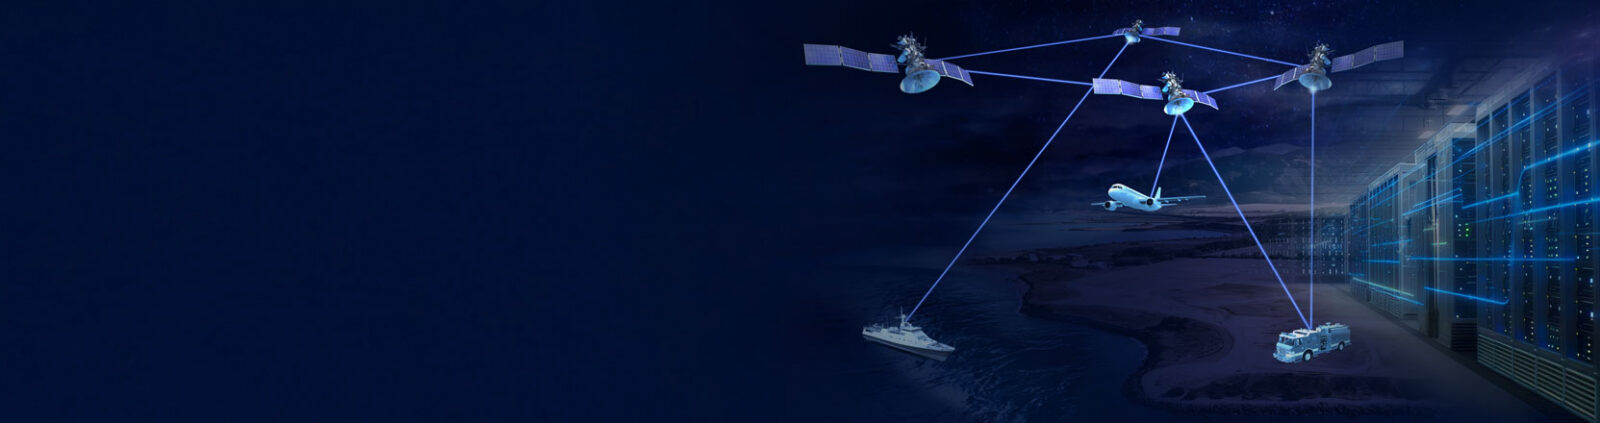
Lasers for optical links. Radio chips for satellite and broadband equipment. Our research on the business, its financial results and the path to production.
Average fair value = mean of the latest Morningstar fair value, one consensus target (LSEG, else TipRanks or the named consensus) and The Claude Trader base case. Broker targets are drawn but not averaged because the consensus already contains them; targets older than 12 months are dropped. Prices: Yahoo Finance chart API SIVE.ST, daily close. Refreshed on request, not a live feed. Data JSON ↗
Added · Content updated · Evidence reviewed · Source publication date unverified · Review after 2026-11-26
Downloaded · Based on original local file creation time; source publication time unverified. Open video directly ↗
Supplementary video commentary; its claims have not been independently audited. Use the dated issuer disclosures and evidence checks in the written analysis below.
Sivers supplies components to equipment makers. It does not sell the entire data centre, satellite network or consumer device.
✳
LIGHT-BASED TECHNOLOGY
The light source inside the system.
Sivers makes semiconductor lasers used in optical communications and sensing. In a data link, its laser supplies light; other parts encode information, transmit it through fibre and detect it.
Sivers makes radio-frequency and beamformer chips that process high-frequency signals and help antenna arrays steer a beam. It also sells modules, some integrating antennas.
Added · Content updated · Evidence reviewed · Source · Period end 2026-06-30 · Review after 2026-11-26
WHAT DROVE Q2 2026 HARDWARE GROWTH?
Wireless products drove the increase.
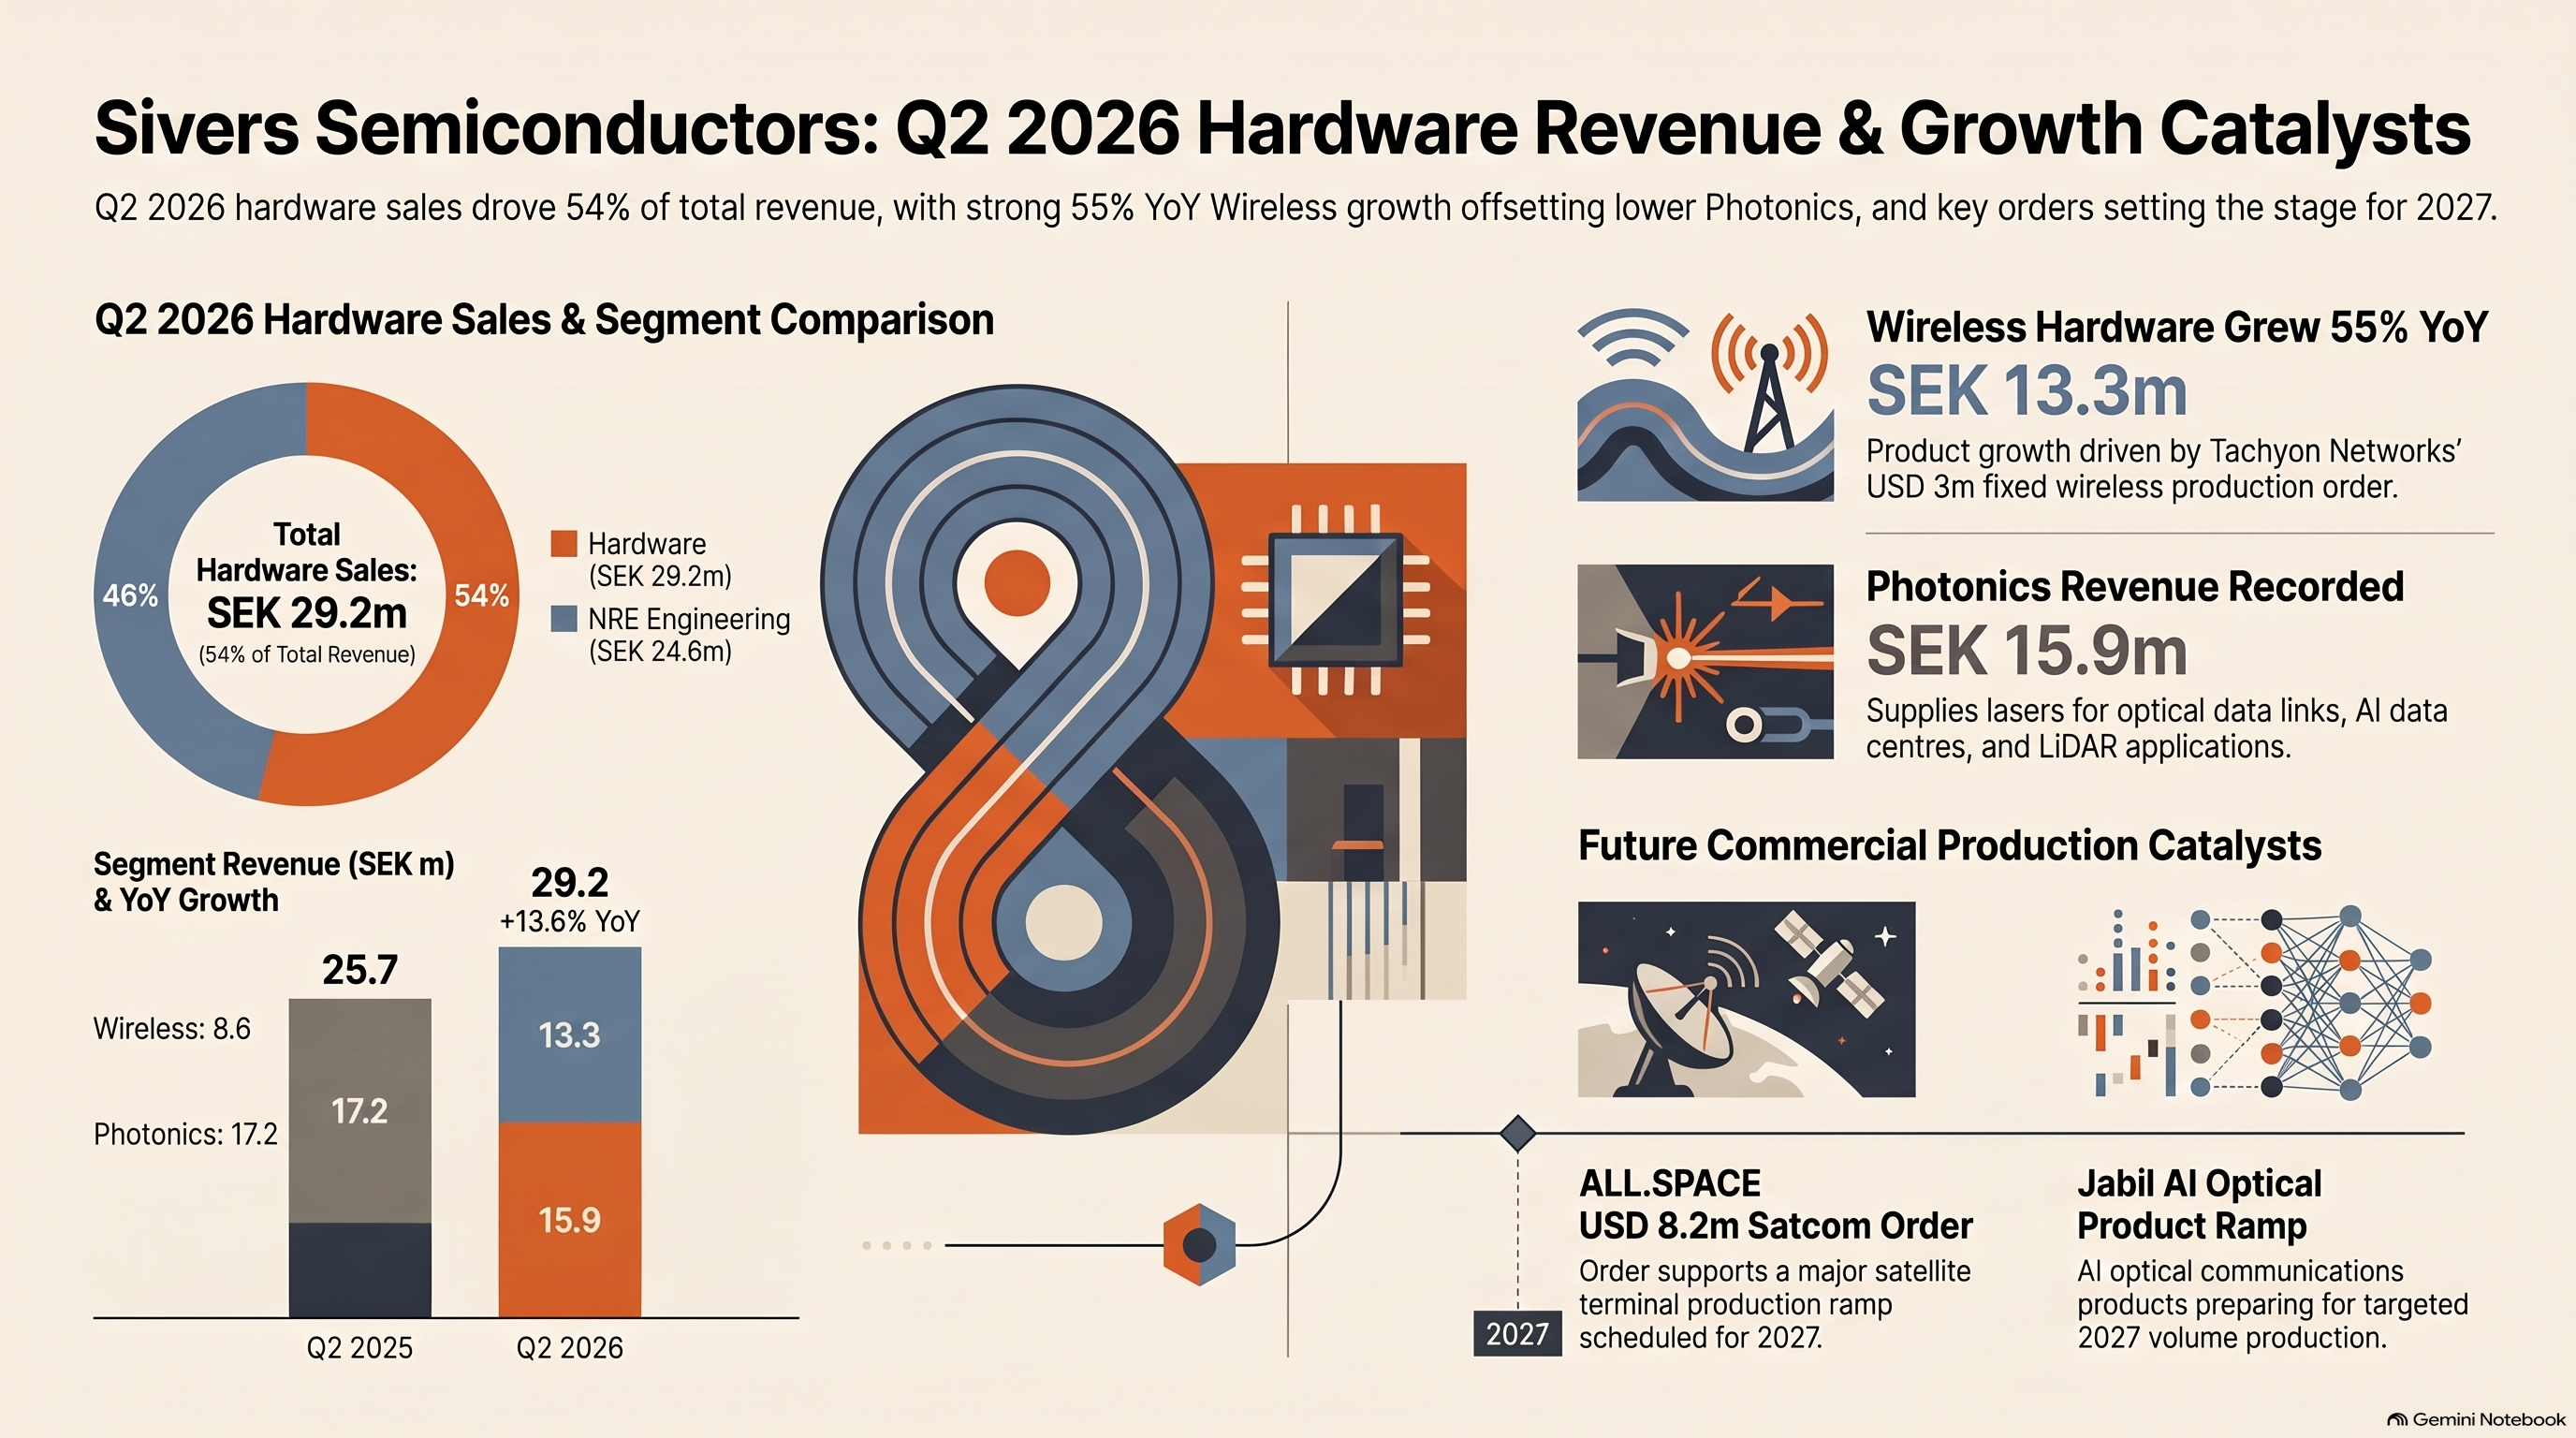
Hardware revenue rose from SEK 25.7m to 29.2m year on year. Wireless hardware grew by about 55%, more than offsetting lower Photonics sales.
Hardware revenue · SEK m
Q2 ’25
Q2 ’26
Wireless chips and modules
8.6
13.3
Photonics / lasers
17.2
15.9
Management attributes product growth to customer programmes progressing toward production. It highlighted builds against Tachyon Networks’ initial USD 3m production order for fixed wireless broadband. The company does not disclose each customer’s contribution to Q2 sales, so the exact share of growth attributable to Tachyon is unknown.
Timing matters: ALL.SPACE’s USD 8.2m order supports a 2027 production ramp. In the August update, Jabil-related AI optical products were also preparing for anticipated 2027 production. Those future opportunities do not establish the source of sales already recorded in Q2.
Why total revenue still fell: hardware added SEK 3.5m, while engineering (NRE) revenue fell from SEK 35.5m to 24.6m. Management cited a shift of resources toward future product ramps, US defence budget delays, customer programme timing and currency effects. Across the full first half, hardware revenue also declined, from SEK 66.9m to 56.8m; Q2’s improvement is not yet an established growth trend.
Our read: a stronger product mix has not yet delivered operating profitability or positive operating cash flow. June cash excludes later financing movements; a current runway estimate needs reconciliation.
Added · Content updated · Evidence reviewed · Source publication date unverified · Period end 2026-06-30 · Review after 2026-11-26
Q2 2026 / VISUAL SUMMARY
Hardware revenue, at a glance.
Reader-provided infographic · Gemini Notebook watermark. This illustration is separate from the issuer’s financial disclosures.
Downloaded · Financial period: Q2 ended 30 June 2026 · Original source publication time unverified. Open full-resolution image ↗
Accuracy note: the graphic’s stacked bars show hardware revenue (Wireless 13.3m + Photonics 15.9m = SEK 29.2m), rather than total segment revenue. Photonics total revenue happens to equal its hardware revenue here; total Wireless revenue was SEK 37.9m. Prior-year rounded components do not exactly add to the reported 25.7m hardware total. Tachyon’s exact contribution to Q2 growth was not disclosed. Use the sourced figures and timing explanation above to interpret the illustration.
Publisher-issued distribution notice located. No current rating or target inferred.
Keep the labels: a fair-value estimate is different from a Buy rating; a January target is historical; discontinued coverage is not an active view. We have not calculated target upside against an unverified current price. Dated source records ↗
Detailed assumptions and unresolved questions. The 22 October 2026 research (where the laser sits, competitors, scenarios, valuation, leadership, fact audit) is open by default; earlier topics open on click.
Thesis underwriting: from source idea to investable conclusion
The source thesis gives us a set of questions to investigate. It does not supply the answer to all of them. This is our analytical framework, rather than a claim about Serenity's exact language or current portfolio.
Underwriting question
The bullish proposition
What a disciplined investor needs to establish
Our current assessment
Industry structure and scarcity value
A hard-to-replace laser component becomes a bottleneck as optical links scale
Substitution risk, qualified competing suppliers, yield, customer dependence and pricing power
Product relevance is supported; durable scarcity and excess returns have not been demonstrated in this memo
Commercial conversion
Engineering engagement becomes recurring production demand
Qualification milestones, firm order size, delivery schedules and repeat purchases
Today's LiDAR orders advance one program; wider customer ramps remain to be measured
Normalized earnings power
Larger product volumes create operating leverage
Revenue by product, gross margin, fixed-cost absorption, working capital and reinvestment
The operating model is still loss-making; future margin expansion is a hypothesis
Capex phasing, utilization, cash generation and dilution-adjusted value per share
Capacity plans are disclosed; investment returns cannot yet be underwritten
Variant perception
Our view differs materially from expectations embedded in the share price
A current valuation, a credible expectations baseline and evidence for a different outcome
Not established: this memo has not yet measured what today's market price implies
Catalyst path and rerating
Results, customer ramps or a potential US listing change investor expectations
A dated sequence of observable events and a reason they change cash-flow expectations or required returns
We can track milestones; a listing or publicity alone does not establish higher intrinsic value
Risk/reward and margin of safety
Conservative realizations still leave attractive upside against a defined downside
Bear/base/bull operating assumptions, financing needs, dilution and valuation sensitivity
Pending current market inputs; no numerical upside/downside ratio is asserted
The central debate: does Sivers become an economically attractive volume supplier, or does it remain a technically relevant business that requires substantial capital before shareholders see cash? This is the bridge between a compelling supply-chain narrative and an investment conclusion.
Our burden of proof: recurring deliveries and product economics must substantiate the growth story; valuation must then leave adequate compensation for delay, financing and competition. An insightful source can generate an excellent research question even when the share price already discounts a favorable answer.
Financing: avoid combining different dates
The issuer's Q2 results announcement describes approximately SEK 825 million of gross directed issues during the quarter, including the large issue resolved at quarter end, and subsequent conversion of the USD 12 million loan. A resolution, settlement, debt conversion and cash receipt are distinct events. Gross proceeds also differ from usable net cash.
The CEO's August letter says the remaining USD 5 million term loan was repaid in August. Treat that as a dated management statement; it is not a verified 20 October cash balance or proof that every lease or other obligation disappeared.
We do not compute a current runway or enterprise value from the June cash balance plus headline fundraising amounts. The missing bridge is: opening cash, settled net proceeds, cash spent, loan repayments, subsequent working capital and remaining obligations.
Valuation: a framework with explicit missing inputs
The 29 September EGM notice states 356,740,332 issued ordinary shares, including 12,872,916 held by the company. That implies 343,867,416 ordinary shares outside treasury on that date. This calculation is not a fully diluted forecast or confirmation of the count today.
The Q2 report presents FY2025 sales of SEK 302.8 million. The following is our illustrative arithmetic, using September shares outside treasury and that historical sales figure. Prices are hypothetical, not current quotations. Equity value / sales is not enterprise value / sales.
Hypothetical share price
Illustrative equity value
Equity value / FY2025 sales
SEK 10
SEK 3.44 billion
11.4x
SEK 25
SEK 8.60 billion
28.4x
SEK 50
SEK 17.19 billion
56.8x
Formula: share price × 343,867,416 / 302,800,000. These examples show why a promising component story needs a demanding valuation examination. They do not identify fair value. The next model must connect current enterprise value to achievable revenue, operating margins, reinvestment, dilution and the time before shareholders receive cash. A comparison with a much larger semiconductor company is not a substitute for that bridge.
A traceable reference to commentary around the opportunity pipeline and production conversion
Primary operating evidence
Sivers reports, regulatory notices and announcements linked throughout this memo
Reported results and the issuer's own statements, with dates and forward-looking claims identified
Our analytical work
This report's calculations, debate and checkpoints
Independent interpretation of those sources, with missing evidence exposed
We have not reconstructed Serenity's full original post history. Therefore “most recommended,” exact mention counts, current conviction and current holdings remain unverified. The tracker describes SIVE as a leading conviction idea; that characterization is attributed to the tracker, not an independently established ranking. An original-post audit would need a complete collection window and a definition separating recommendations, mentions, replies and duplicates.
We also checked Nanalyze's August SIVE discussion as a counterpoint. Its conclusions are secondary commentary; we do not adopt unverified allegations or historical performance claims. The business case is tested against operating evidence rather than the popularity of either a bullish or bearish commentator.
What is still open
Independently verified current quote with exchange, currency and timestamp.
Updated issued, treasury and fully diluted share counts after subsequent actions.
A reconciled current cash/debt/capex bridge and valuation model.
Counterparty confirmation of material programs where publicly available; company announcements are attributed to the issuer.
Customer concentration, production margins, yields and firm order values where not disclosed in the reviewed material.
A reproducible audit of the original Serenity claims.
Update 2026-10-22: the current quote, share count, cash position and a scenario valuation are now recorded in the dated valuation section below; customer concentration and the Serenity post audit remain open.
These gaps limit the investment conclusion. They do not prevent following a measurable business thesis. The next report update should compare actual shipments, financial results and financing with these checkpoints rather than merely repeating the AI-photonics narrative.
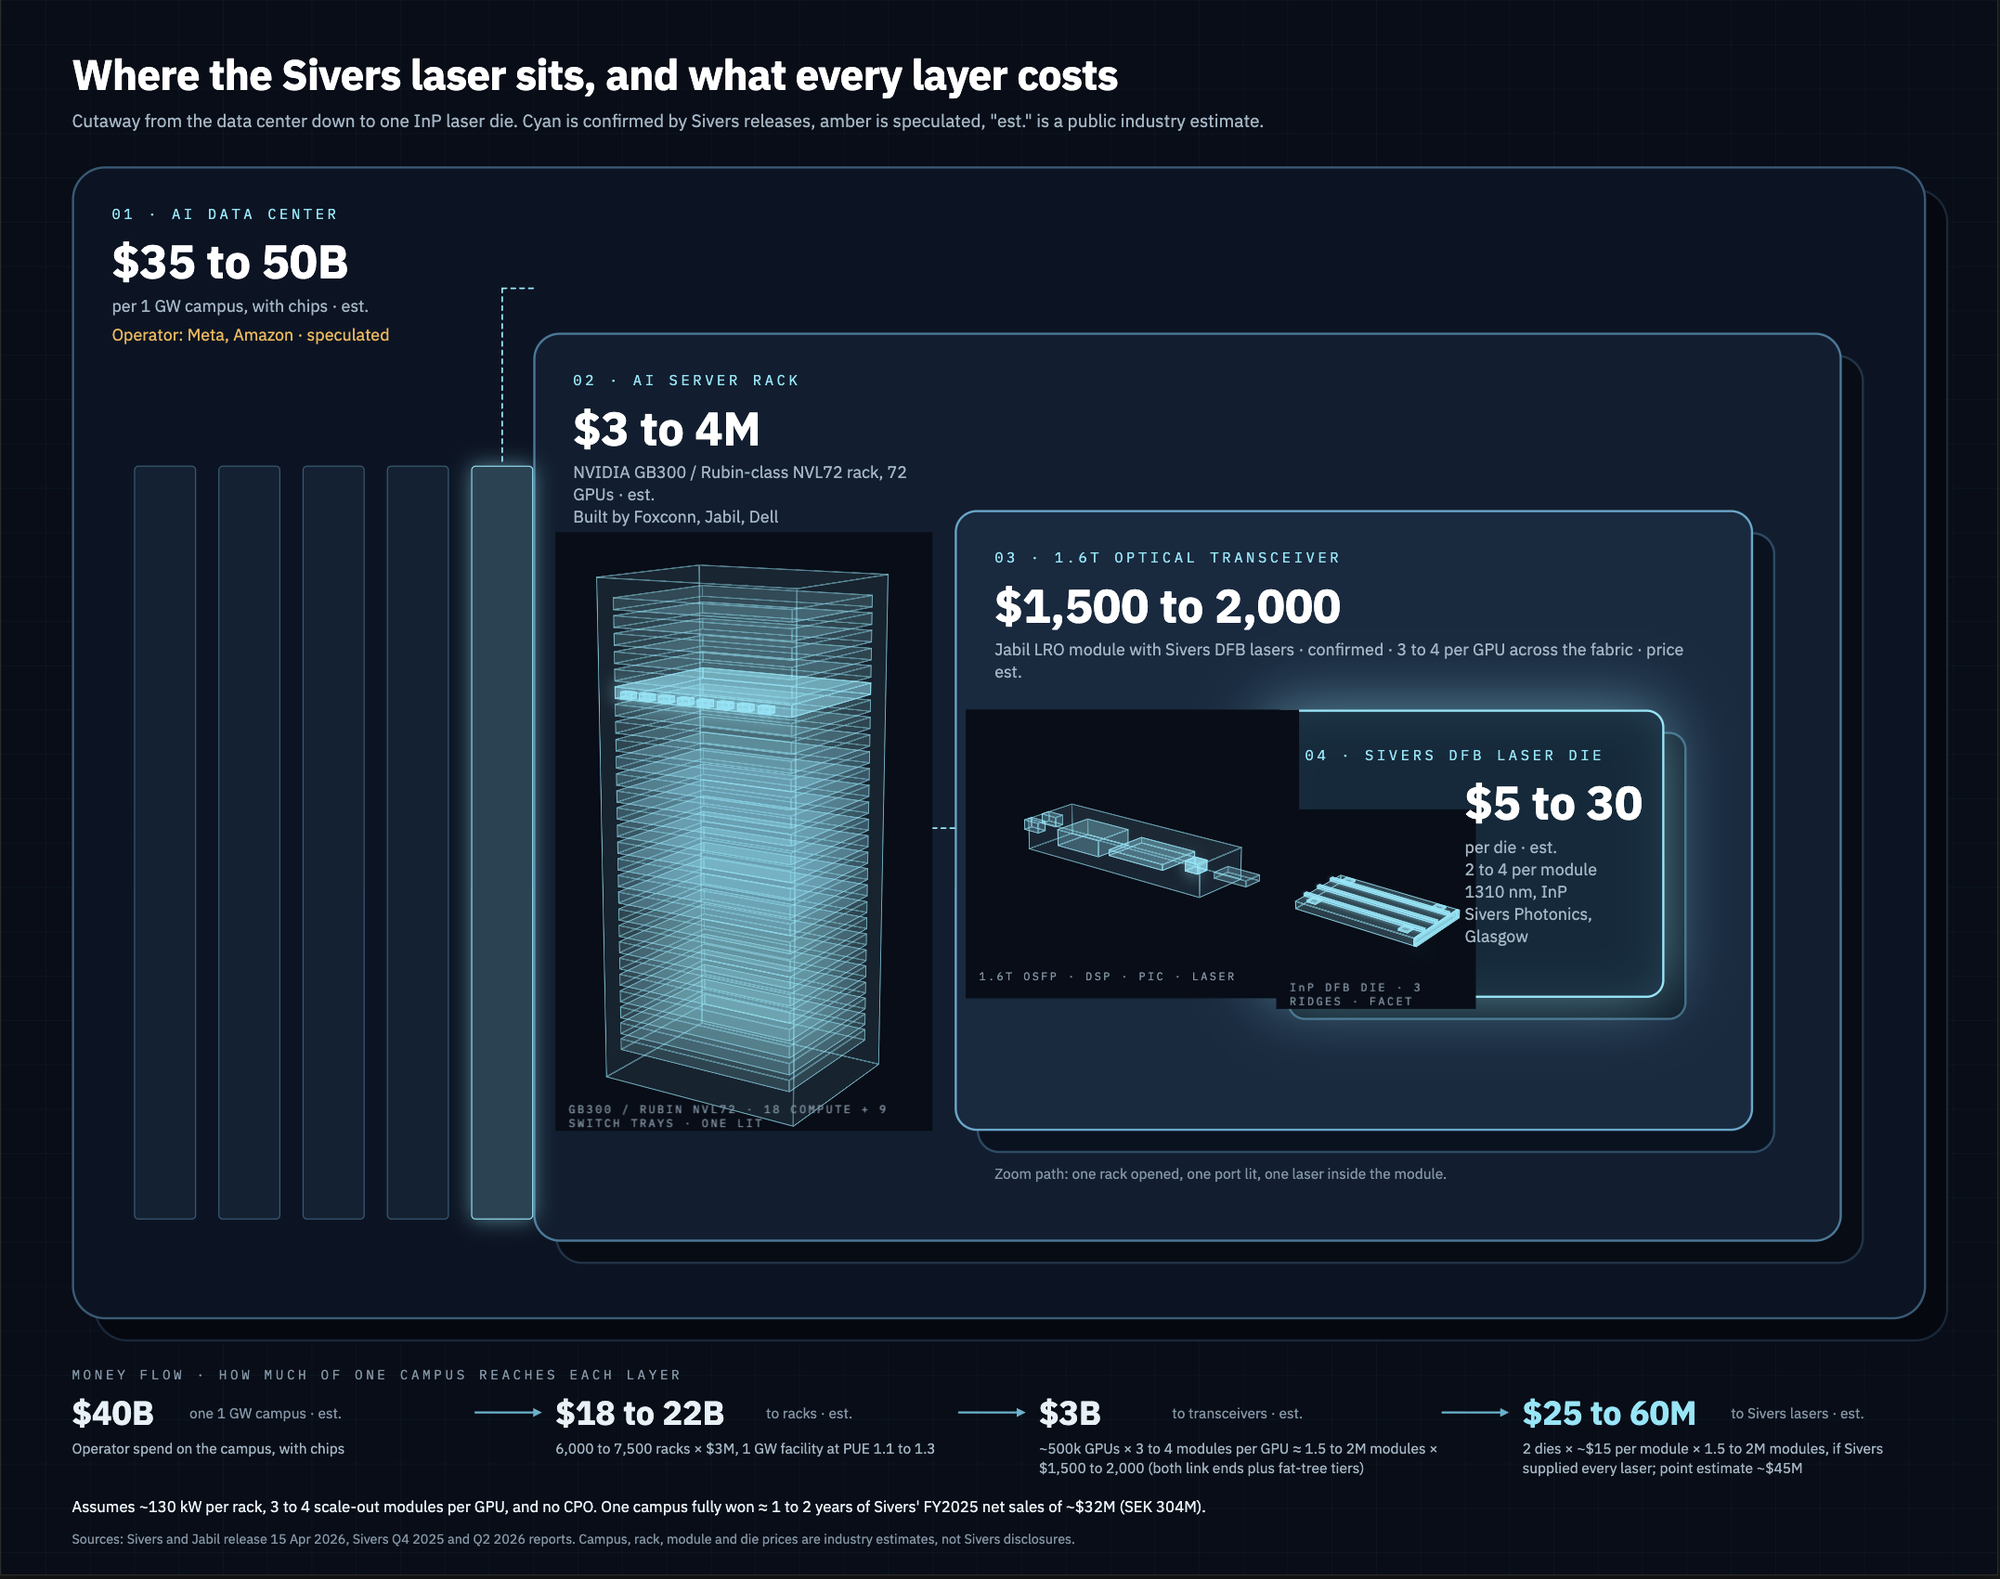
Where the laser sits: one campus, four layers, and the money that reaches Sivers
01 · AI data center$35 to 50B per 1 GW campus, with chips · est.Operator: Meta or Amazon · speculated
$40Boperator spend on one campus · est.
02 · AI server rack$3 to 4M NVIDIA GB300 / Rubin-class NVL72, 72 GPUs, ~130 kW · est.Assembled by Jabil, Foxconn or Dell
$18 to 22Bto racks: 6,000 to 7,500 racks × $3M, 1 GW facility at PUE 1.1 to 1.3 · est.
03 · 1.6T optical transceiver$1,500 to 2,000 per OSFP module, 3 to 4 per GPU across the fabric · est.Jabil LRO module with Sivers DFB lasers · confirmed 15 Apr 2026
~$3Bto transceivers: ~500k GPUs × 3 to 4 modules × $1,500 to 2,000 · est.
04 · Sivers DFB laser die$5 to 30 per die, 2 to 4 per module, 1310 nm InP · est.Sivers Photonics, Glasgow
$25 to 60Mto Sivers lasers if it supplied every laser; point estimate ~$45M · est.
One 1 GW campus, outermost to innermost. Assumes ~130 kW per rack, 3 to 4 scale-out modules per GPU, 2 dies × ~$15 per module, no co-packaged optics. One campus fully won is worth one to two years of Sivers' FY2025 net sales (~SEK 307M, ~$32M). Download the poster (PNG)
Added: 2026-10-22. Content updated: 2026-10-22. Evidence reviewed: 2026-10-22. Review checkpoint: 2026-11-26. All dollar figures are industry estimates (est.), not Sivers disclosures; operators are speculated.
On the web page this section opens with a responsive HTML diagram; the static export is available as a cutaway poster (PNG).
Layer
What it is
Vendor
Unit cost (est.)
1 · AI data center
One 1 GW campus, with chips
Operator: Meta or Amazon (speculated, via Jabil and Ayar Labs analyst mapping)
Money flow for one campus (est.): $40B operator spend → $18 to 22B to racks (6,000 to 7,500 racks × $3M, 1 GW facility at PUE 1.1 to 1.3) → about $3B to transceivers (~500k GPUs × 3 to 4 modules × $1,500 to 2,000, both link ends plus fat-tree tiers) → $25 to 60M to Sivers lasers (2 dies × ~$15 per module × 1.5 to 2M modules, if Sivers supplied every laser; point estimate ~$45M). Assumptions: ~130 kW per rack, 3 to 4 scale-out modules per GPU, no co-packaged optics. One campus fully won is therefore worth one to two years of Sivers' FY2025 net sales of about SEK 307M (~$32M).
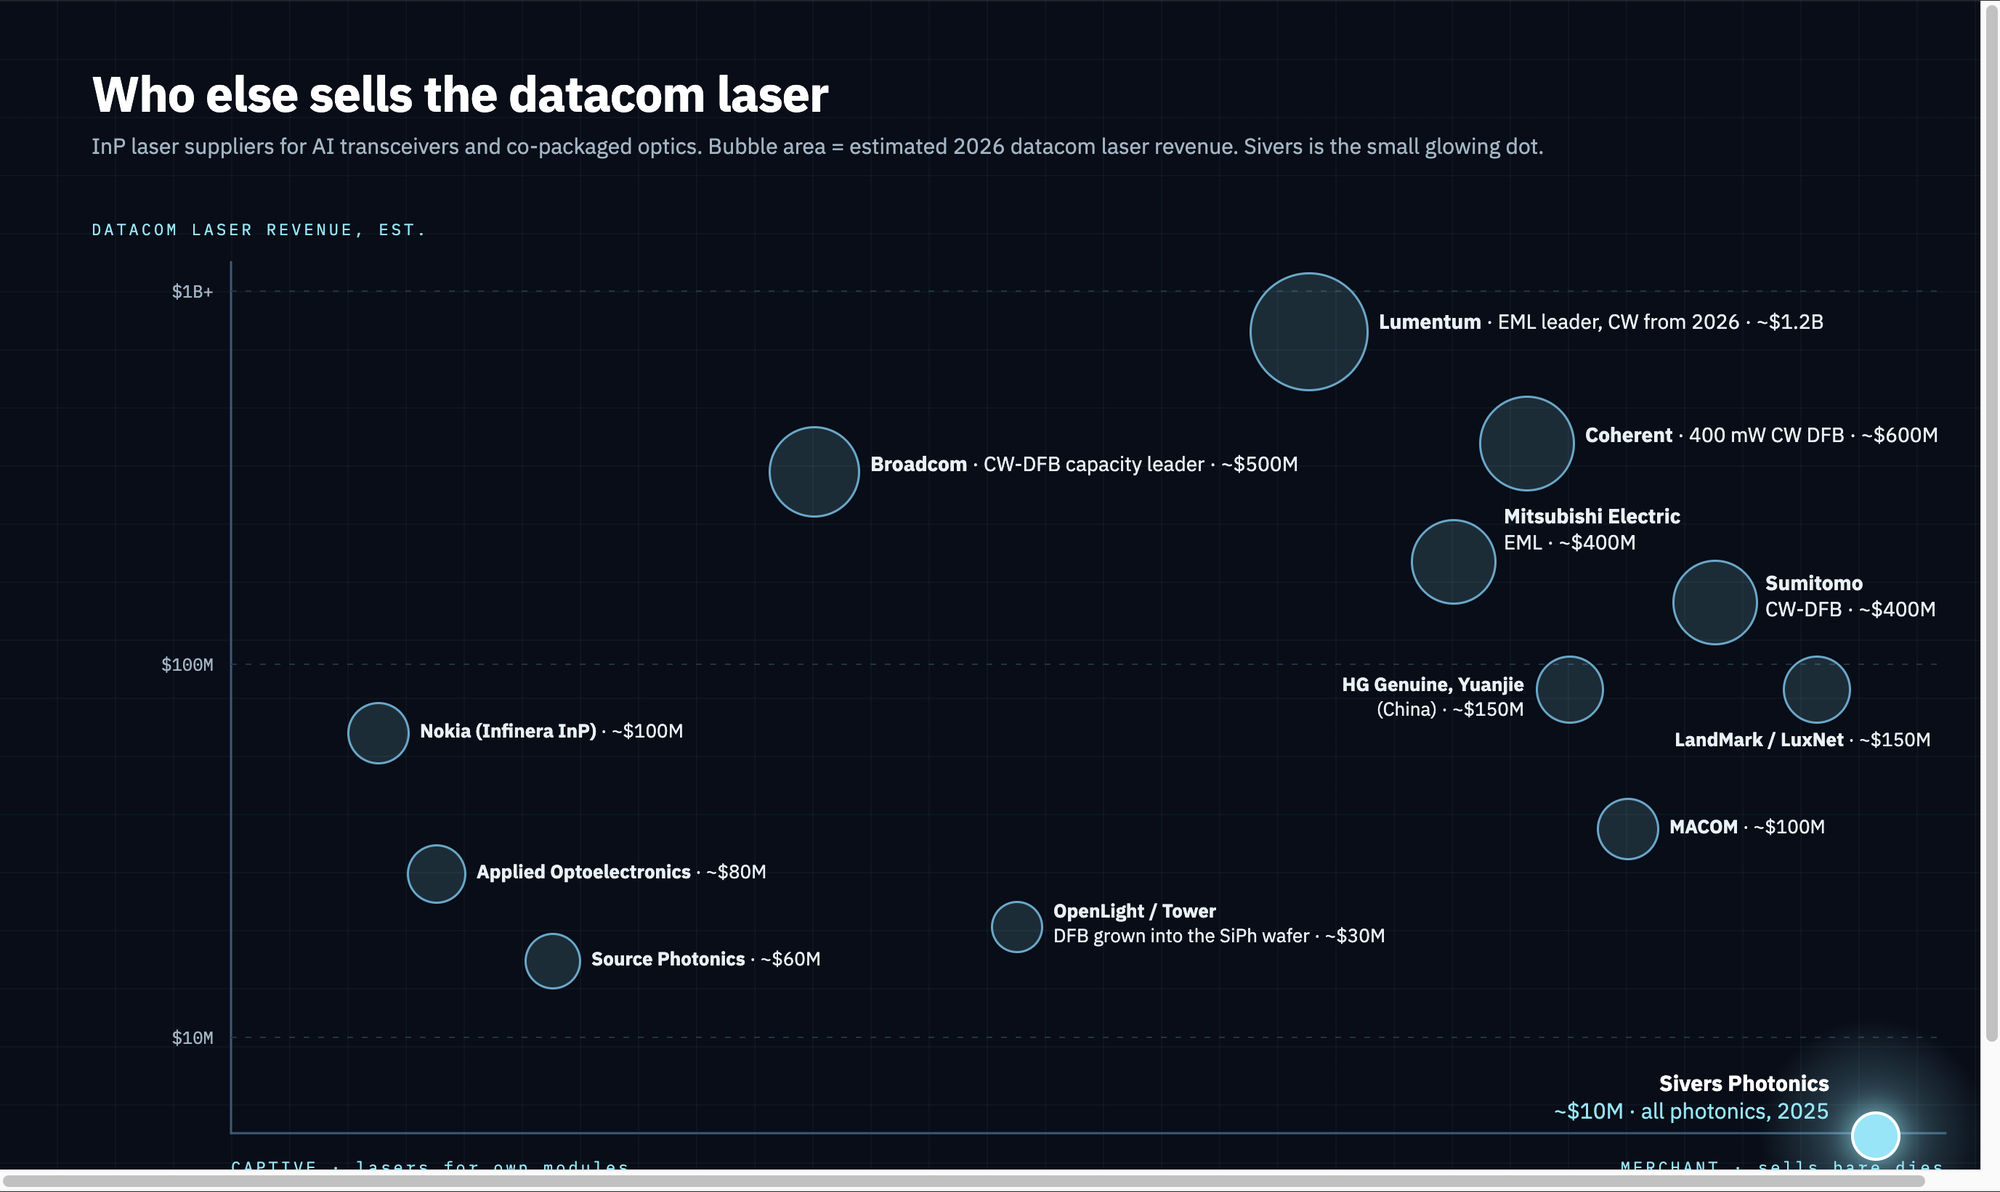
Competitor, est. 2026 datacom laser revenueSivers Photonics, 2025 photonics sales
Company
Role
Est. revenue
Merchant CW DFB dies
Lumentum
EML leader; CW lasers for own transceivers from fiscal Q3 2026
~$1.2B
EML yes; CW mostly captive
Coherent
Merchant; 400 mW CW-DFB for SiPh and CPO
~$600M
Yes
Broadcom
Largely captive; CW-DFB capacity leader
~$500M
Partly
Sumitomo Electric
Merchant; CW-DFB capacity co-leader
~$400M
Yes
Mitsubishi Electric
Merchant EML
~$400M
EML mainly
LandMark / LuxNet
Merchant CW-DFB foundry (Taiwan)
~$150M
Yes
HG Genuine, Yuanjie
Merchant (China)
~$150M
Yes
MACOM
Merchant
~$100M
Yes
Nokia (Infinera InP)
Captive
~$100M
No
Applied Optoelectronics
Captive
~$80M
No
Source Photonics
Captive
~$60M
No
OpenLight / Tower
DFB grown into the SiPh wafer
~$30M
Platform, not dies
Sivers Photonics
Merchant
~$10M (SEK 93.4M, 2025)
Yes
Bar length is proportional to estimated 2026 datacom InP laser revenue (analyst estimates; Sivers is its reported 2025 photonics sales). Download the poster (PNG)
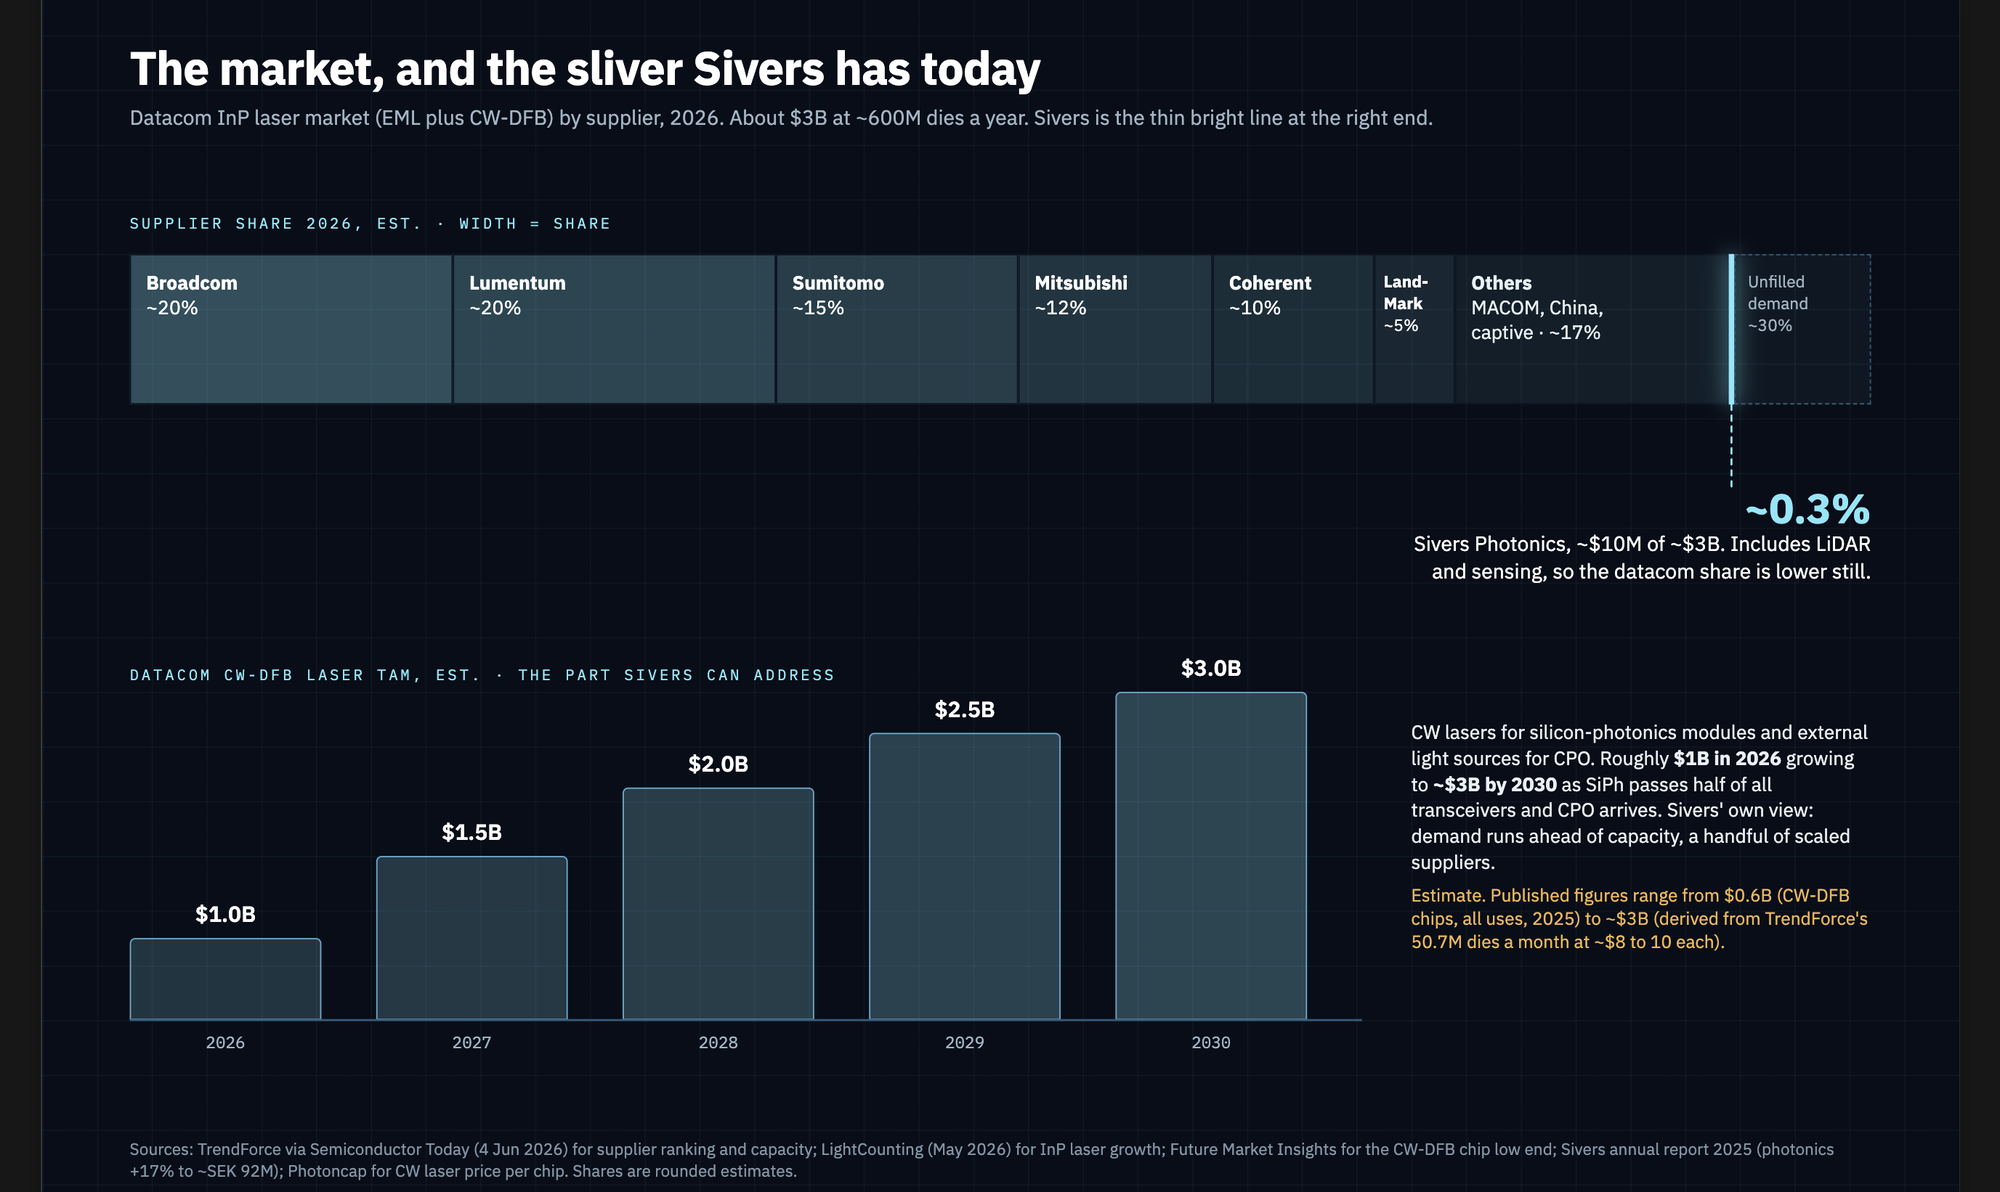
Supplier share, datacom InP lasers (EML plus CW-DFB), 2026 · rounded estimates consistent with TrendForce groupings
Broadcom ~20%
Lumentum ~20%
Sumitomo ~15%
Mitsubishi ~12%
Coherent ~10%
LandMark ~5%
Others (MACOM, China, captive) ~17.7%
Sivers Photonics ~0.3% (~$10M of ~$3B)
CW-DFB laser market Sivers can address: the weakest input
$1B by 2030 · published (Future Market Insights, CW-DFB chips, all uses; $579M in 2025)
$1B
~$3B · unit-derived est. (TrendForce 50.7M dies a month × $8 to 10)
~$3B
Sivers' share is about 0.3% of the unit-derived ~$3B, lower still for datacom alone. Share needed under each denominator is in the scenarios. Download the poster (PNG)
Added: 2026-10-22. Content updated: 2026-10-22. Evidence reviewed: 2026-10-22. Review checkpoint: 2026-11-26. Revenue figures per competitor are analyst estimates for 2026 datacom InP lasers unless marked otherwise.
On the web page this section opens with a responsive HTML diagram; the static export is available as a competitor map poster (PNG).
Company
Role
Est. 2026 datacom laser revenue
Sells merchant CW DFB dies?
Lumentum
EML leader; CW lasers for its own transceivers from fiscal Q3 2026
~$1.2B
EML yes; CW mostly captive so far
Coherent
Merchant; 400 mW CW-DFB for silicon photonics and CPO
~$600M
Yes
Broadcom
Largely captive; CW-DFB capacity leader
~$500M
Partly
Sumitomo Electric
Merchant; CW-DFB capacity co-leader
~$400M
Yes
Mitsubishi Electric
Merchant EML
~$400M
EML mainly
LandMark / LuxNet
Merchant CW-DFB foundry (Taiwan)
~$150M
Yes
HG Genuine, Yuanjie
Merchant (China)
~$150M
Yes
MACOM
Merchant
~$100M
Yes
Nokia (Infinera InP)
Captive
~$100M
No
Applied Optoelectronics
Captive
~$80M
No
Source Photonics
Captive
~$60M
No
OpenLight / Tower
DFB grown into the silicon-photonics wafer
~$30M
Platform, not dies
Sivers Photonics
Merchant
~$10M (SEK 93.4M, all photonics, 2025, annual report)
Yes
On the web page this section opens with a responsive HTML diagram; the static export is available as a market-share poster (PNG).
TrendForce (June 2026) puts Broadcom, Lumentum and Sumitomo at about 55% of EML plus CW-DFB supply, and Broadcom, Sumitomo, Coherent and LandMark at about 74% of CW-DFB capacity, with Lumentum's EML capacity booked through 2027. TrendForce reports capacity (50.7M dies a month) rather than dollars. At $8 to 10 per die that is roughly $3B a year, which would make Sivers' share about 0.3%, lower still for datacom alone.
The market size is the weakest input. The only published dollar series is Future Market Insights: $579M for CW-DFB chips (2025, all uses) growing to about $1B by 2030. The $3B figure is unit-derived from TrendForce. The scenarios below therefore show the share Sivers would need under both denominators.
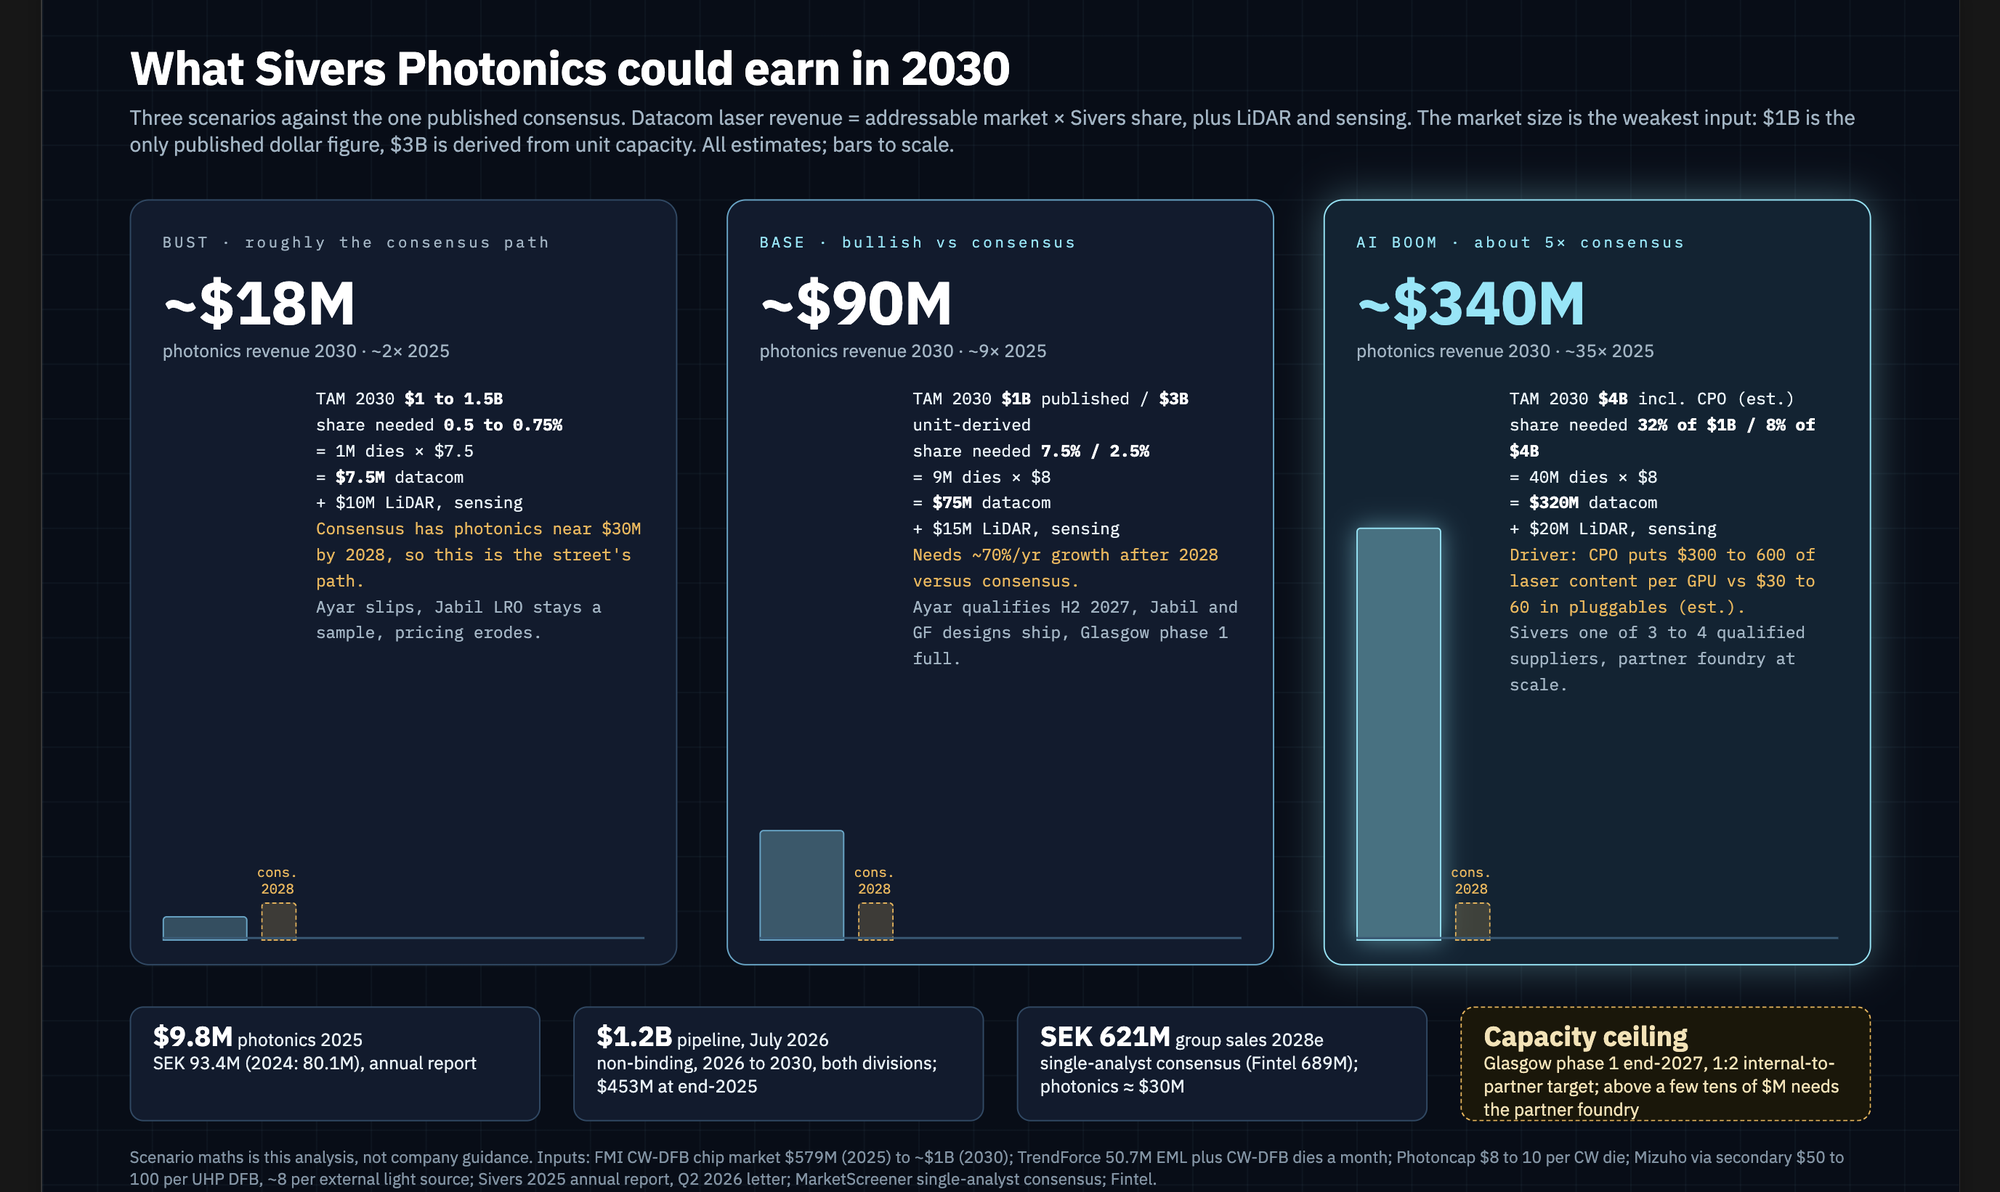
Scenarios: 2030 photonics revenue under bust, base and AI boom (22 October 2026)
Added · Content updated · Evidence reviewed · Source · Period end 2026-06-30 · Review after 2026-11-26
$1.5B TAM × 0.5% = 1M dies × $7.5 = $7.5M datacom + $10M LiDAR and sensing Share needed: 0.8% of $1B / 0.3% of $3B
Base · bullish versus consensus
~$90M
photonics 2030 · ~9× 2025
$90M
cons. 2028 ~$30M
$2.5B TAM × 3% = 9M dies × $8 = $75M datacom + $15M LiDAR and sensing Share needed: 7.5% of $1B / 2.5% of $3B · needs ~70% a year after 2028
AI boom · about 5× consensus
~$340M
photonics 2030 · ~34× 2025
$340M
cons. 2028 ~$30M
$4B TAM incl. CPO (est.) × 8% = 40M dies × $8 = $320M datacom + $20M LiDAR and sensing Share needed: 32% of $1B / 8% of $4B · driver: $300 to 600 of laser content per GPU under CPO vs $30 to 60 in pluggables (est.)
Bars are to one scale (boom = full width). Consensus: Redeye via MarketScreener, group sales SEK 273M (2026), 458M (2027), 621M (2028). Base 2025: SEK 93.4M (~$9.8M). Estimates, not company guidance. Download the poster (PNG)
Added: 2026-10-22. Content updated: 2026-10-22. Evidence reviewed: 2026-10-22. Review checkpoint: 2026-11-26. This analysis, not company guidance. The published consensus is a single house (Redeye via MarketScreener): group sales SEK 273M (2026), 458M (2027), 621M (2028); Fintel shows 689M for 2028. Consensus implies photonics of roughly $30M in 2028.
On the web page this section opens with a responsive HTML diagram; the static export is available as a scenarios poster (PNG).
Scenario
Arithmetic
2030 photonics revenue
Share needed at $1B TAM / $3B TAM
Versus consensus
Bust
$1.5B TAM × 0.5% = 1M dies × $7.5 = $7.5M datacom + $10M LiDAR and sensing
~$18M
0.8% / 0.3%
Roughly the consensus path
Base
$2.5B TAM × 3% = 9M dies × $8 = $75M + $15M
~$90M
7.5% / 2.5%
Bullish: needs ~70% a year after 2028
AI boom
$4B TAM (CPO external light sources add $1B+) × 8% = 40M dies × $8 = $320M + $20M
~$340M
32% / 8%
About 5× consensus
Implied growth from the SEK 93.4M (~$9.8M) 2025 base over five years: bust 1.8× (~12% a year), base 9× (~55% a year), boom 34× (~100% a year). The photonics run-rate in H1 2026 was SEK 33.7M, about SEK 67M annualised, so every scenario starts from a lower point than 2025.
What decides the case:
Share, not market size. Going from 0.3% to 3% is the whole base case against suppliers that hold most CW-DFB capacity.
CPO versus pluggables. In a pluggable the Sivers die is a $15 commodity. Analyst estimates put ultra-high-power DFB lasers at $50 to 100 each with about eight per external light source, or $300 to 600 of laser content per GPU under co-packaged optics versus $30 to 60 in pluggables (Mizuho via secondary, siliconmatter). No Ayar Labs SuperNova price is public. Ayar's volume qualification is targeted for H2 2027, so none of it appears before 2028. The boom case is a CPO case.
Capacity ceiling. The Q2 2026 CEO letter says the expanded Glasgow facility is functional by end-2027 and targets a 1:2 ratio of internal to partner-foundry capacity. Revenue above a few tens of millions of dollars in 2027 depends on the partner line.
LiDAR. The 20 October 2026 release confirms production orders: "Sivers will supply the continuous-wave distributed feedback (CW DFB) lasers and optical amplifiers", shipments from Q4 2026, production in 2027, "estimated cumulative revenue potential of USD 53 million to USD 138 million over the customer's product lifecycle" (programme first announced March 2026). This supersedes the USD 28 to 53 million cumulative 2026 to 2030 figure in the Q4 2025 report used in earlier drafts. The scenarios' LiDAR-and-sensing lines ($10 to 20M a year) sit inside that lifecycle range; the first order value is not disclosed.
Pipeline. The $1.2B opportunity pipeline (July 2026) is non-binding, covers 2026 to 2030 and both divisions, and was $453M at end-2025 (Q4 2025 report).
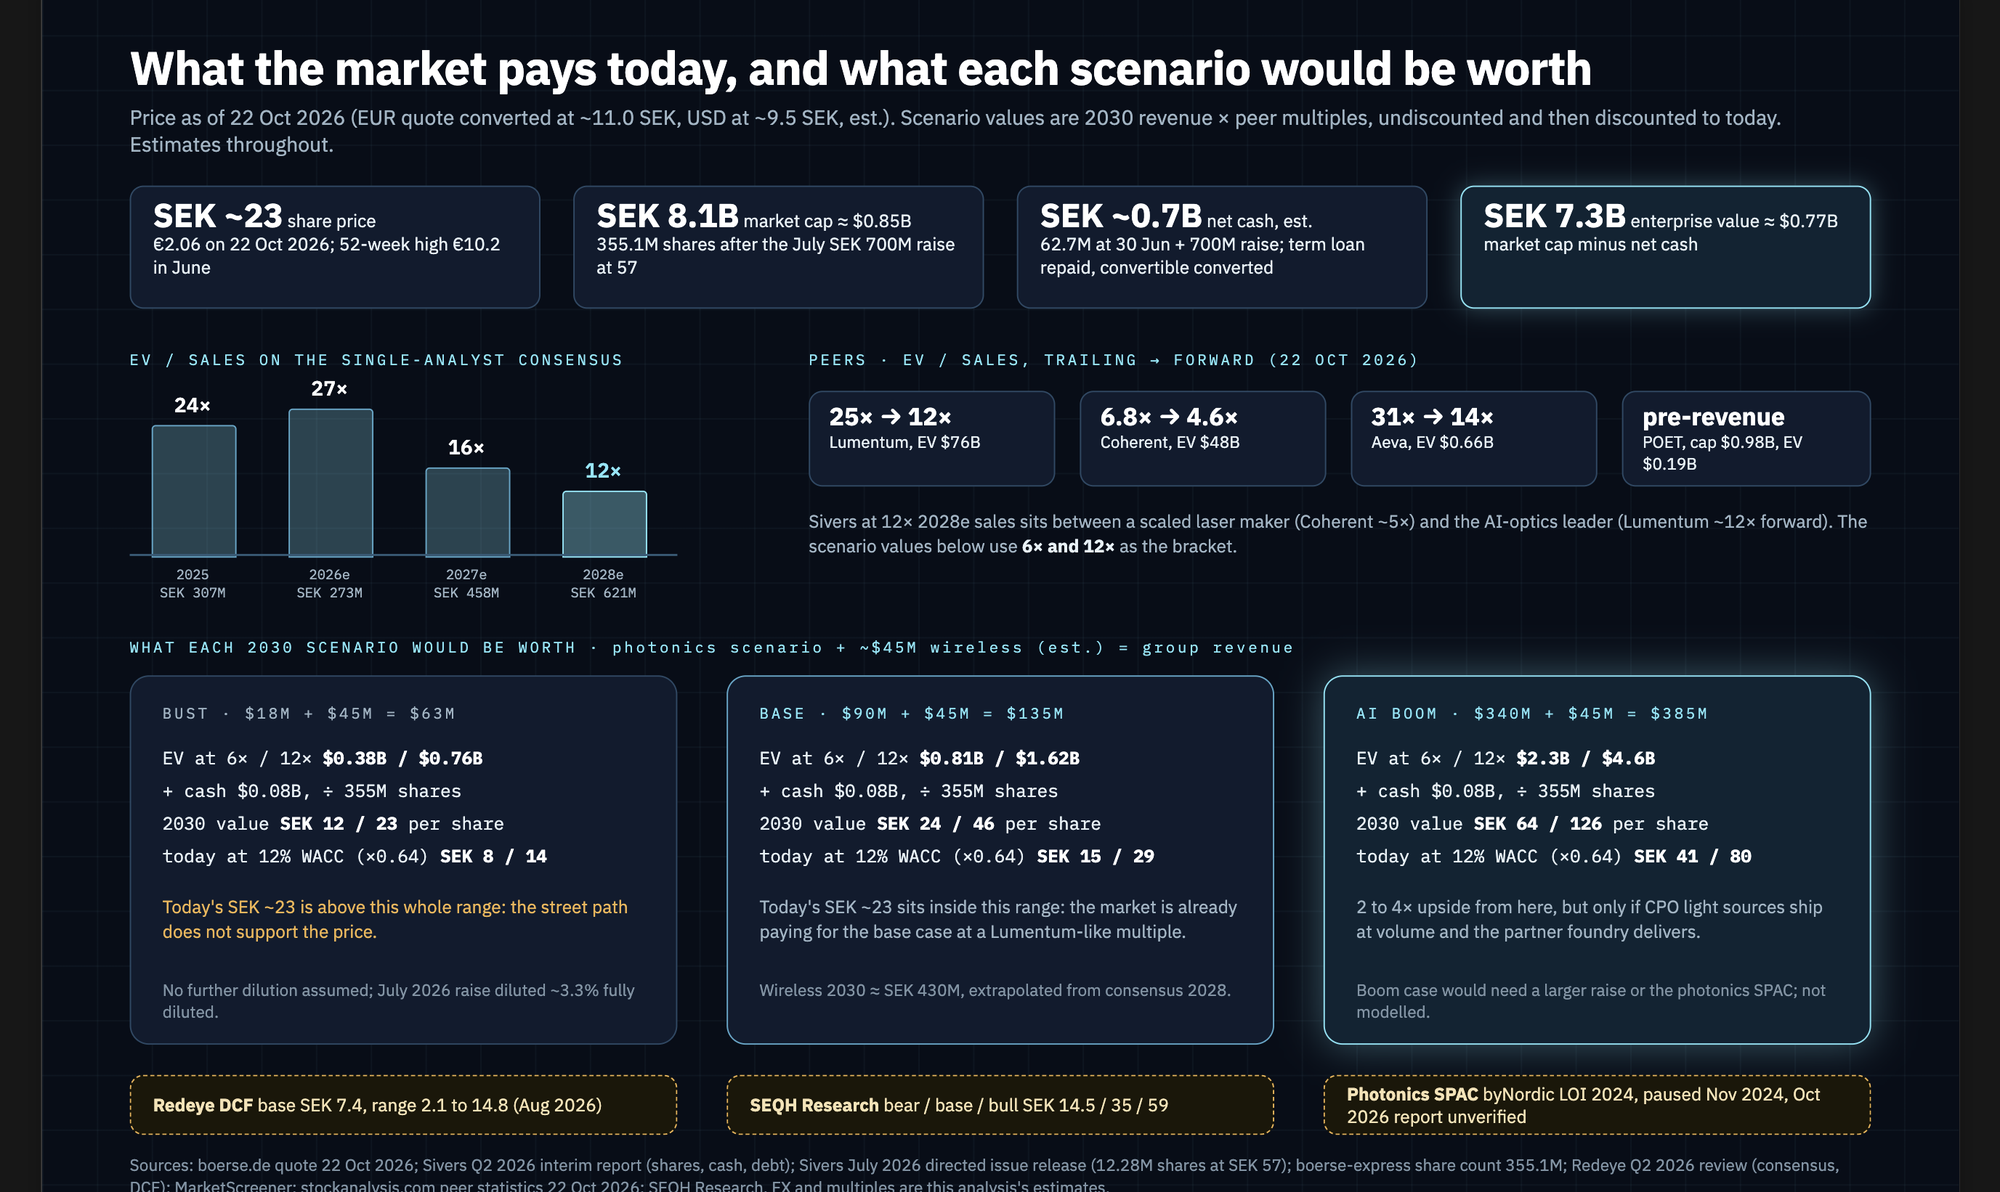
What each 2030 scenario would be worth · photonics scenario + ~$45M wireless (est.) = group revenue; EV at 6× and 12× sales; plus $0.08B cash; ÷ 355M shares; discounted four years at 12% (×0.64)
Scenario
2030 group revenue
EV at 6× / 12×
SEK per share, 2030
SEK per share, today
Bust
$63M
$0.38B / $0.76B
12 / 23
8 / 14below today's ~23
Base
$135M
$0.81B / $1.62B
24 / 46
15 / 29 today's price sits inside this range
AI boom
$385M
$2.3B / $4.6B
64 / 126
41 / 80 2 to 4× upside, needs CPO volume and the partner foundry
At SEK ~23 the market already prices the base case at a Lumentum-like multiple; the consensus path alone does not support the price. FX est. EUR 11.0 and USD 9.5 SEK; no further dilution assumed. Download the poster (PNG)
Added: 2026-10-22. Content updated: 2026-10-22. Evidence reviewed: 2026-10-22. Review checkpoint: 2026-11-26. This resolves the current-quote, share-count and cash items listed as open on 20 October, with the limits stated below. FX est. at EUR 11.0 and USD 9.5 SEK.
On the web page this section opens with a responsive HTML diagram; the static export is available as a valuation poster (PNG).
Item
Value
Source
Share price
€2.06 ≈ SEK ~23 on 22 Oct 2026, 12:31 CET; 52-week high €10.2 (June)
Scenario values. 2030 group revenue = photonics scenario + ~$45M wireless (SEK ~430M, extrapolated from consensus 2028); EV at 6× and 12× sales; plus $0.08B cash; divided by 355M shares; discounted four years at 12% (×0.64). No further dilution assumed.
Scenario
2030 group revenue
EV at 6× / 12×
SEK per share in 2030
SEK per share today
Bust
$63M
$0.38B / $0.76B
12 / 23
8 / 14
Base
$135M
$0.81B / $1.62B
24 / 46
15 / 29
AI boom
$385M
$2.3B / $4.6B
64 / 126
41 / 80
Reading: at SEK ~23 the market already prices the base case at a Lumentum-like multiple. The consensus path alone does not support the price. The boom case offers two to four times, but needs CPO light sources at volume from 2028 and the partner foundry to deliver, and would likely need a larger raise or the photonics listing. Still open after 22 October: the first LiDAR order value and 2027 run-rate (lifecycle USD 53 to 138M is not a one-year forecast), customer concentration, Q3 cash, and a second analyst house. Carnegie, Pareto and Modular Finance estimates were not obtainable; "consensus" here is one house. The byNordic SPAC letter of intent (Aug 2024, paused Nov 2024) never disclosed a valuation.
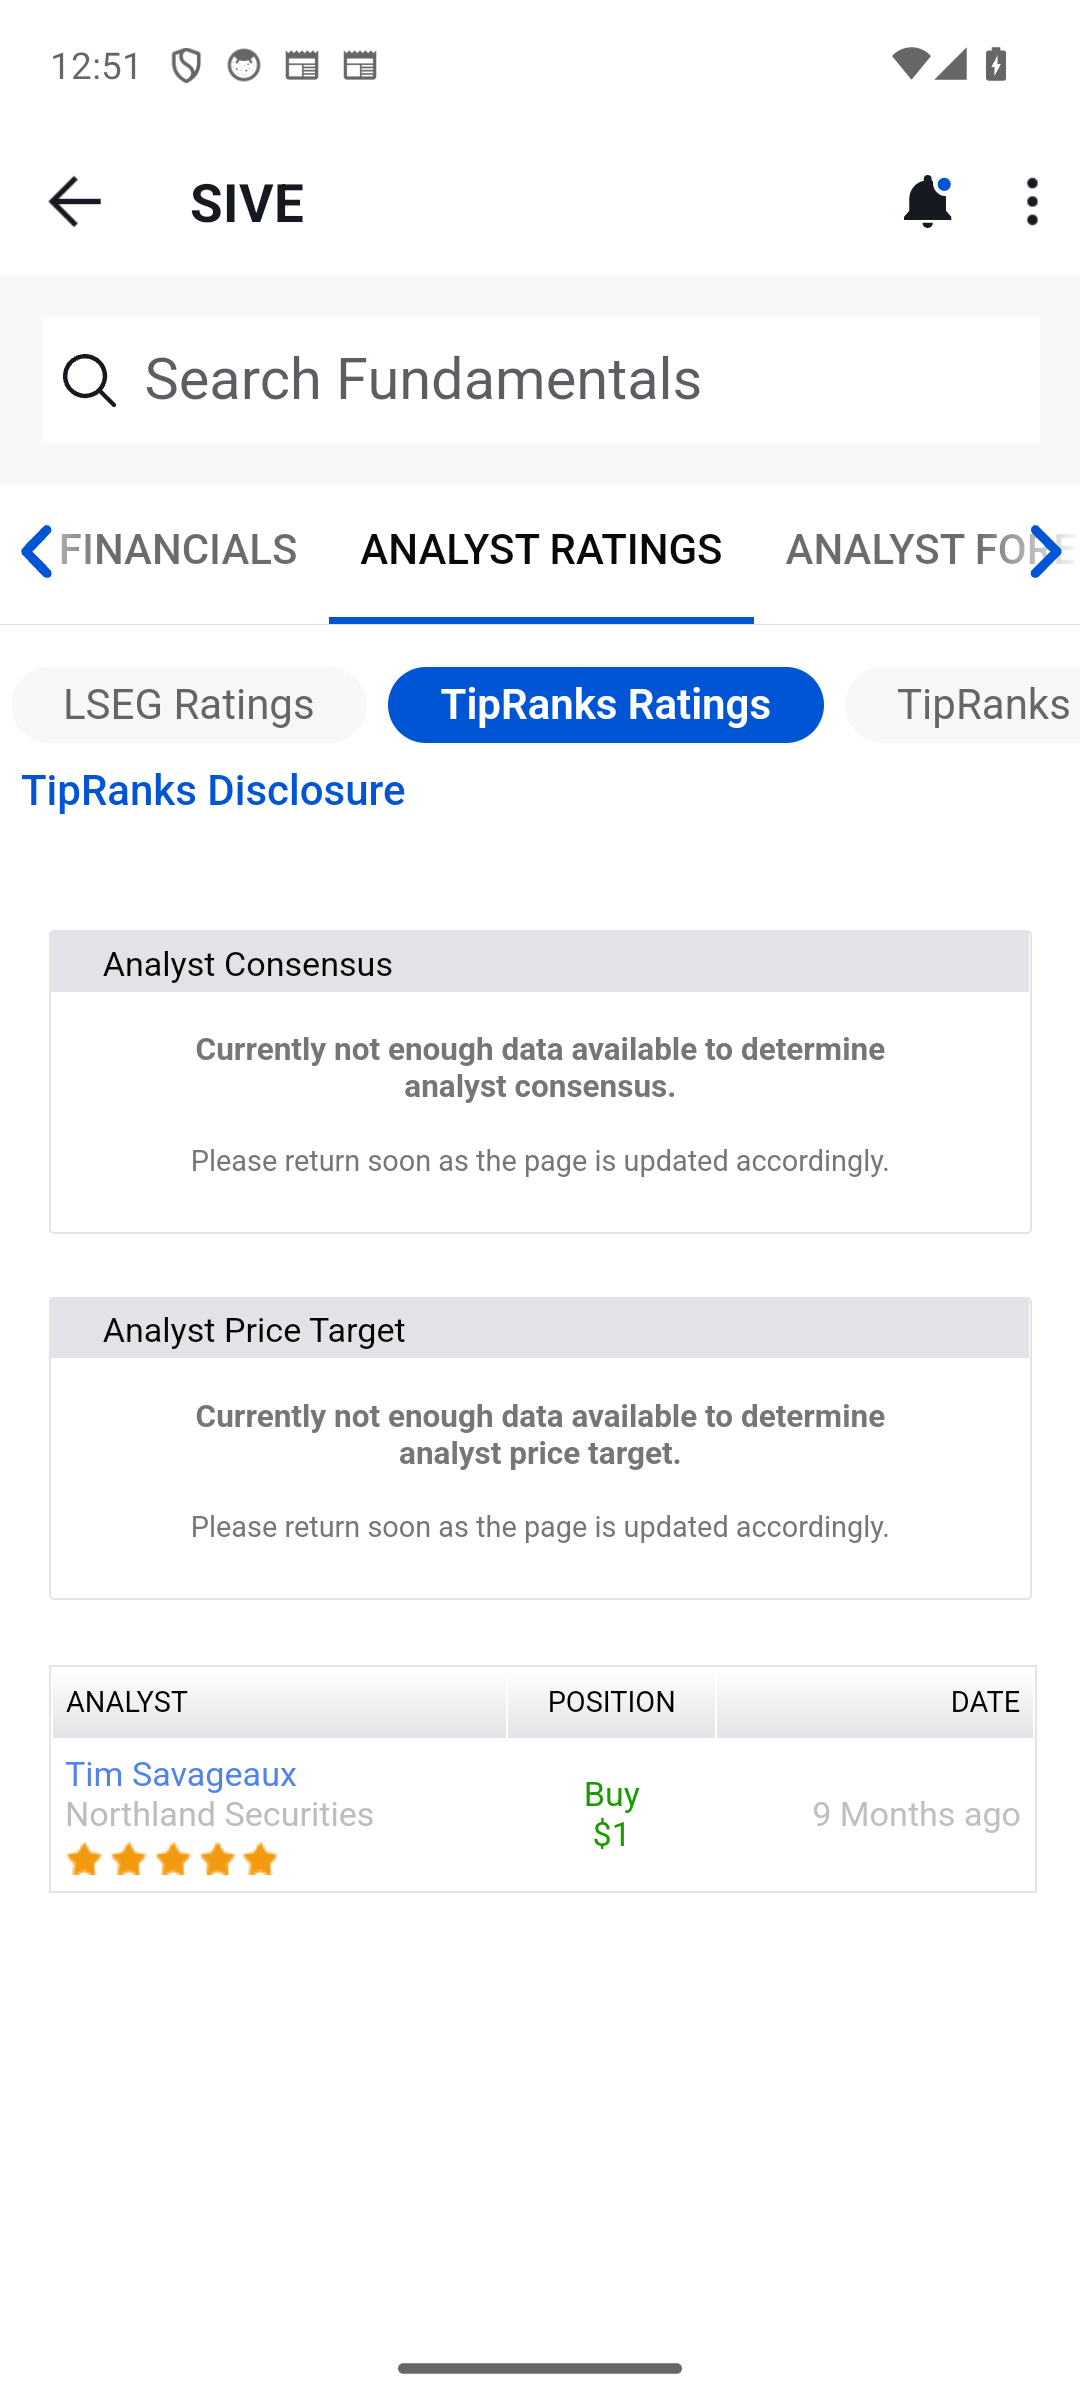
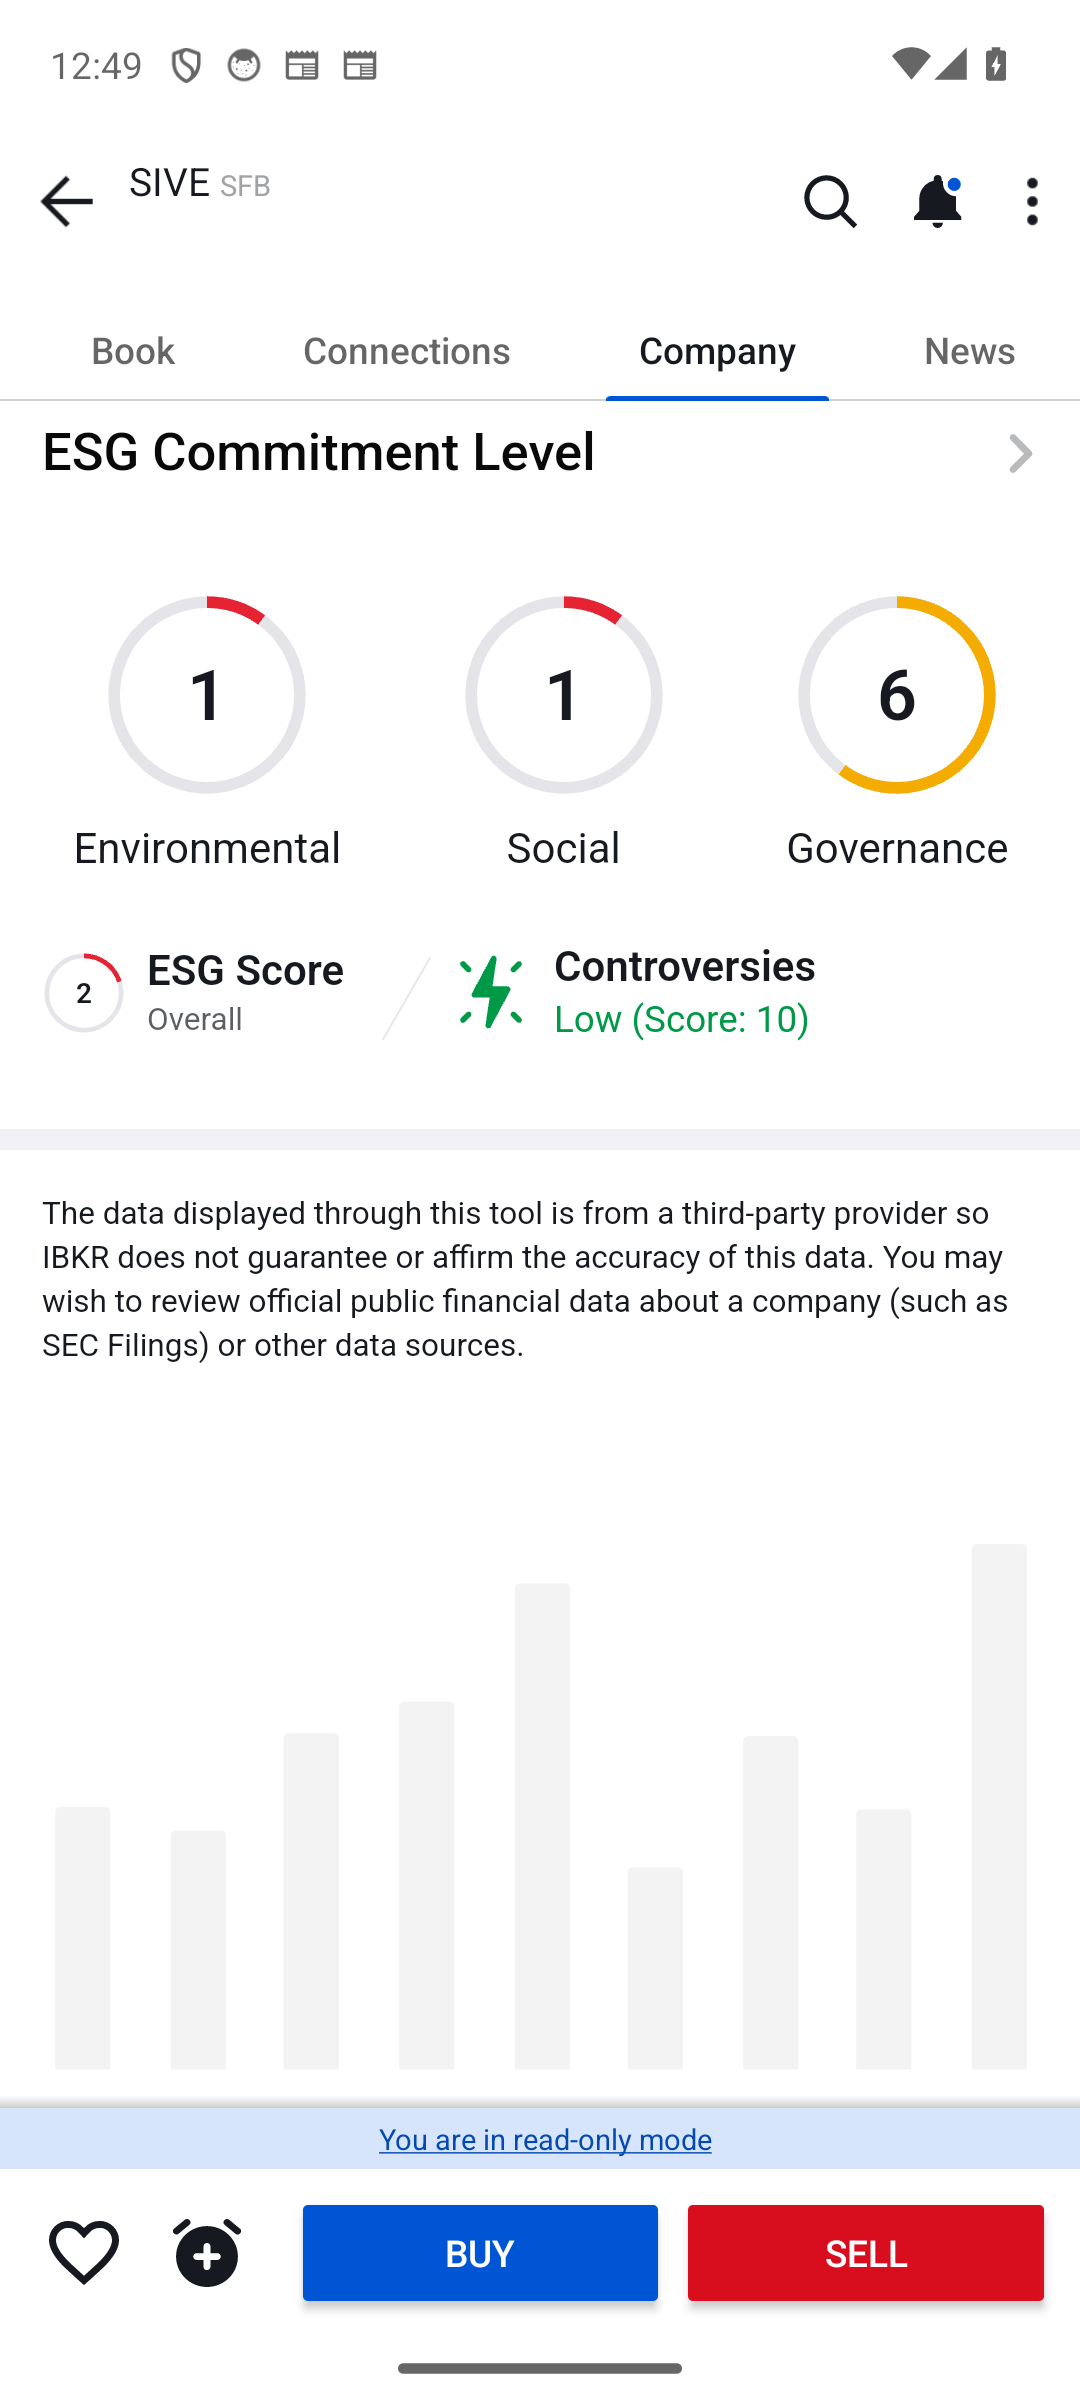
Broker and ratings data, IBKR Mobile, captured 2026-10-22
Added · Content updated · Evidence reviewed · Source · Period end 2026-06-30 · Review after 2026-11-26
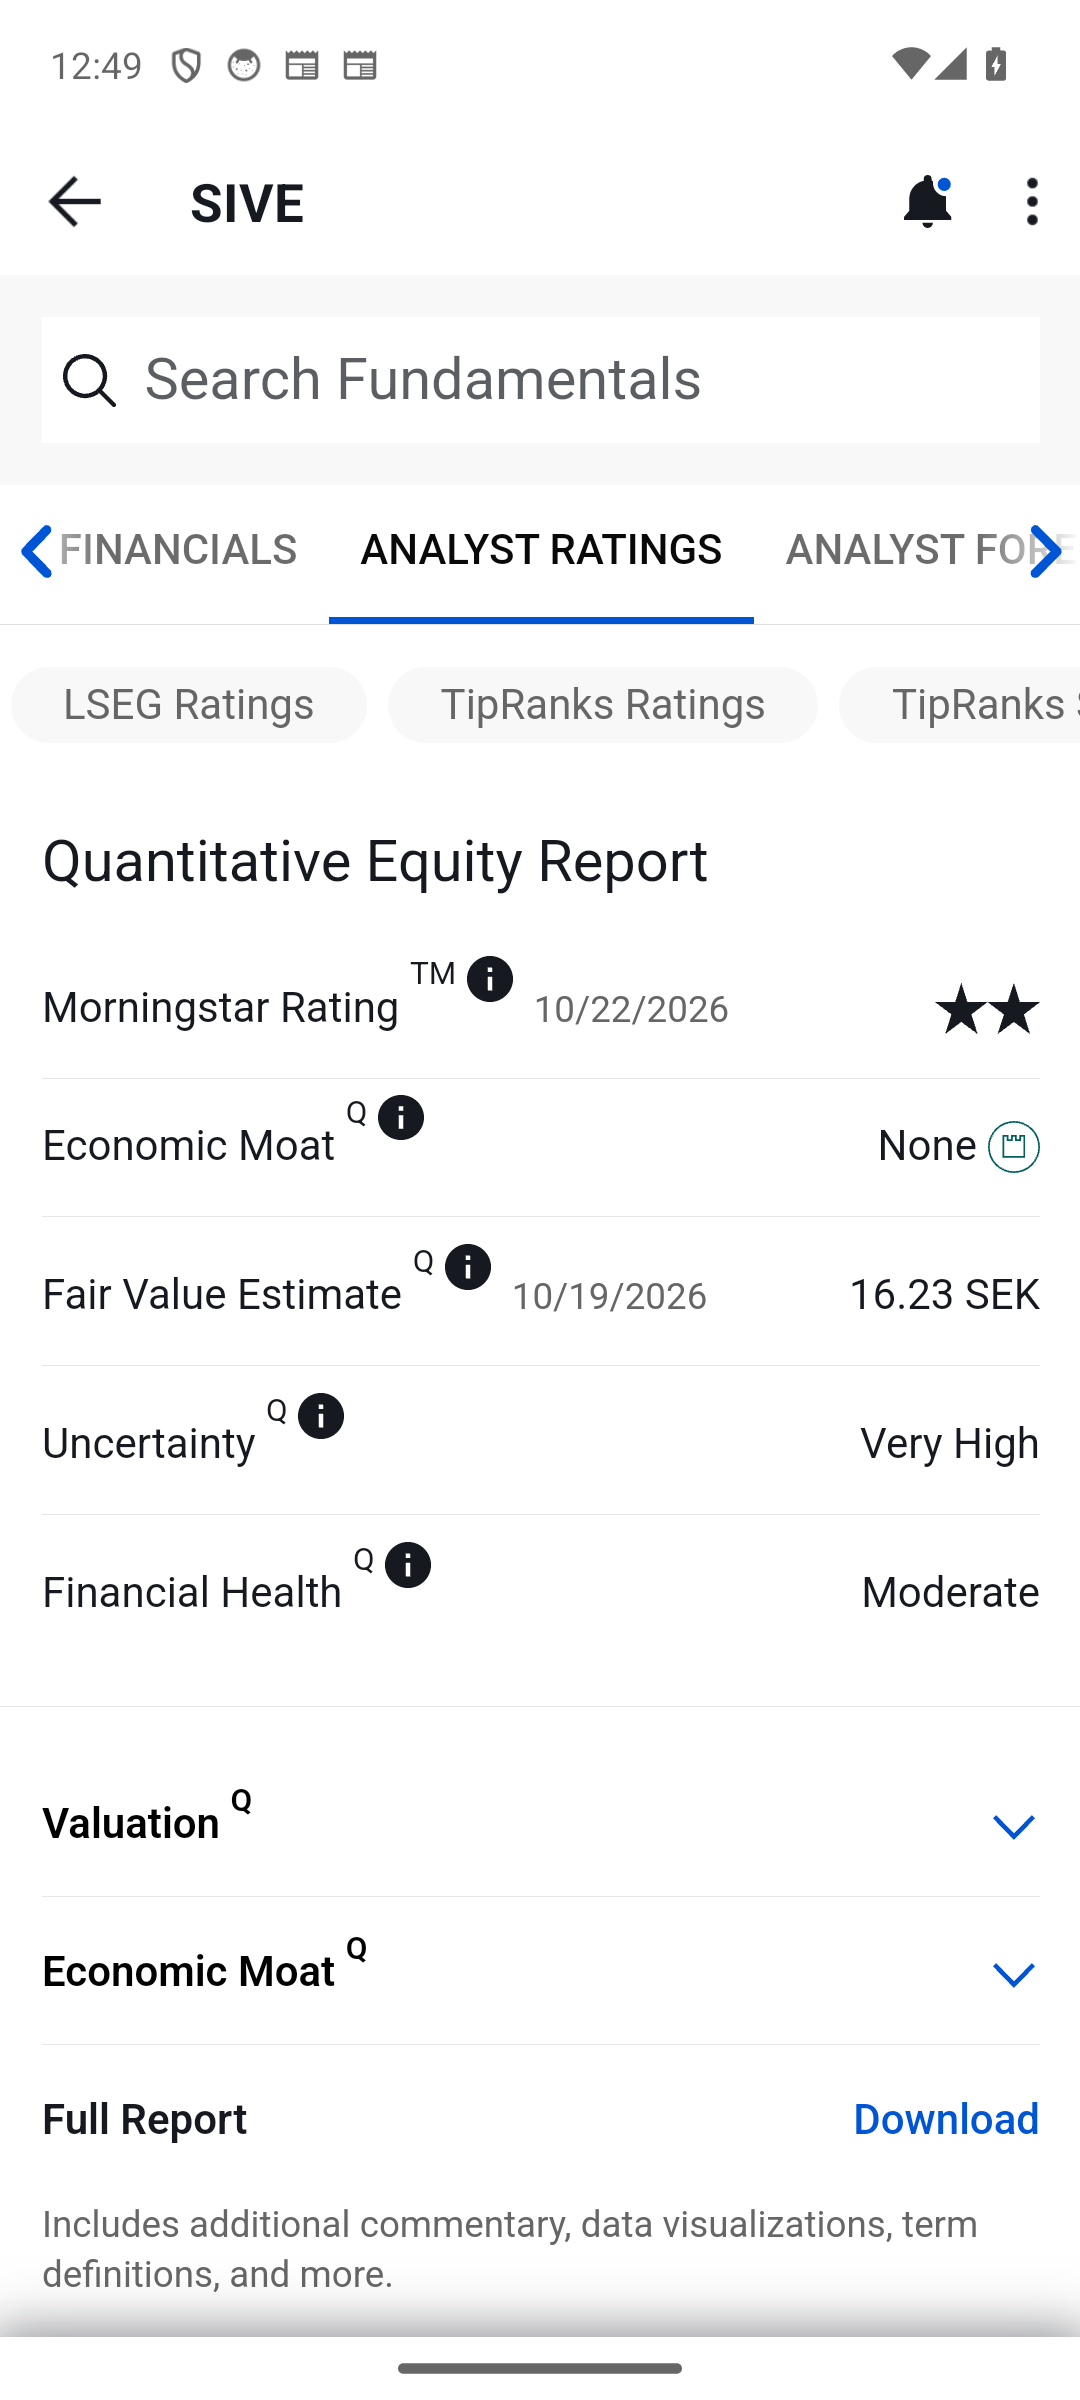
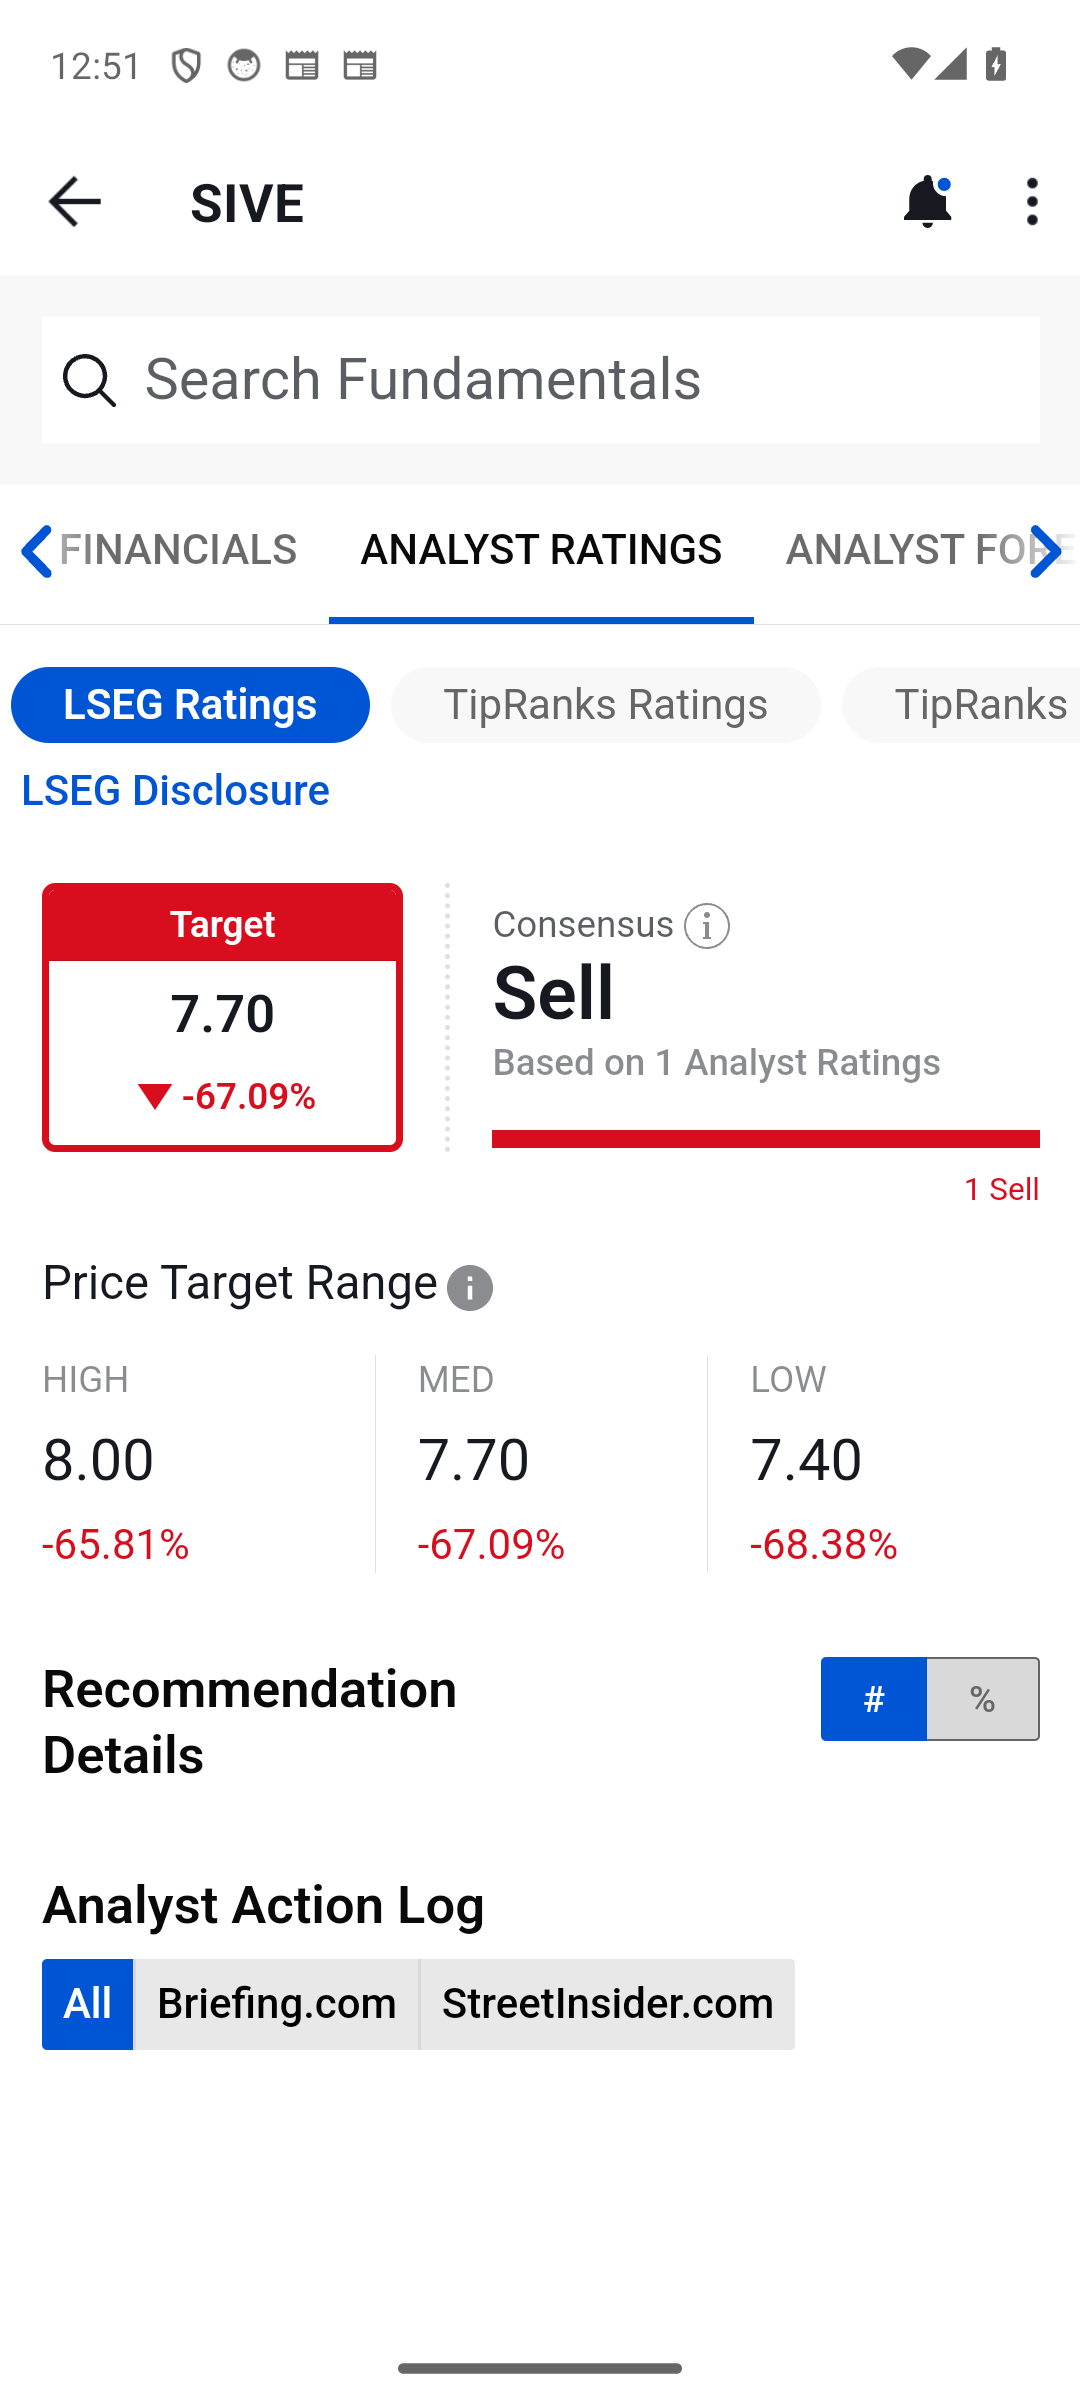
Added: 2026-10-22. Content updated: 2026-10-22. Evidence reviewed: 2026-10-22. Review checkpoint: 2026-11-26. Captured from IBKR Mobile on a read-only login between 12:48 and 12:55 Europe/Luxembourg (+02:00). Every row carries the as-of date IBKR showed and the capture timestamp of the screenshot it was read from. Third-party data (Morningstar, LSEG, TipRanks) via IBKR, not guaranteed by IBKR. Morningstar fields carry the "Q" marker: quantitative model output, not an analyst-written report.
Item
Value
IBKR as-of
Captured (Luxembourg)
Morningstar quantitative rating
2 stars
2026-10-22
2026-10-22T12:49:54+02:00
Economic moat (Q)
None
2026-10-21 (text date)
2026-10-22T12:49:54+02:00
Fair value estimate (Q)
SEK 16.23; stock at a 49% premium
FVE 2026-10-19; text 2026-10-21
2026-10-22T12:50:23+02:00
Uncertainty / financial health (Q)
Very High / Moderate
2026-10-22
2026-10-22T12:49:54+02:00
Earnings yield / book value yield
−3.1% (bottom 20% of global peers) / 12.5% (bottom 10%)
2026-10-21
2026-10-22T12:50:31+02:00
Momentum note (verbatim)
"This share class has outperformed the broader universe over the past year. This outperformance may signify a bull trap, in light of other detractors from our model."
2026-10-21
2026-10-22T12:50:31+02:00
LSEG consensus
Sell, based on 1 analyst (1 Sell)
2026-10-22
2026-10-22T12:51:04+02:00
LSEG price target
mean SEK 7.70 (−67.09% vs price); high 8.00 (−65.81%), median 7.70, low 7.40 (−68.38%); implied price ≈ SEK 23.4
2026-10-22
2026-10-22T12:51:04+02:00
TipRanks consensus and target
Not enough data
2026-10-22
2026-10-22T12:51:18+02:00
TipRanks individual rating
Tim Savageaux, Northland Securities, Buy, target $1 (ADR basis), "9 months ago" (≈ Jan 2026)
2026-10-22
2026-10-22T12:51:18+02:00
TipRanks news sentiment
Not enough data
2026-10-22
2026-10-22T12:51:44+02:00
ESG (Company tab, provider not named)
E 1 · S 1 · G 6; overall 2; controversies Low (score 10)
EPS −1.01; beta 1.594; market cap "8B" SEK; IV 101.4%; put/call interest 0.59. Price, volume and 52-week range blank (no Stockholm market-data subscription)
2026-10-22
2026-10-22T12:48:18+02:00
Key ratios (USD, TTM)
P/S 28.6; P/B 7.51; P/E normalized −31.82; ROE −29.86%; ROA −21.09%; current ratio 1.64; book value per share 0.30; cash per share 0.02
interim 2026-06-30; annual 2025-12-31
2026-10-22T12:53:42+02:00 to 12:53:49+02:00
Income statement, quarter to 2026-06-30 (USD m)
Revenue 5.13 (−12.4% y/y); gross profit −1.87; operating income −11.14; net income −10.96; diluted EPS −0.04
Jun 30, 2026
2026-10-22T12:53:30+02:00 to 12:53:36+02:00
LSEG annual forecasts (SEK, read from bar charts, approximate)
Q3 2026E revenue ~57M, Q4 2026E ~98M; Q2 2026 actual 53.8M vs ~60M estimate
2026-10-22
2026-10-22T12:52:01+02:00 to 12:52:11+02:00
News tab
2026-10-20 Reuters / Dow Jones / PR Newswire: "Strategic LiDAR Customer Initiates Production Orders With Sivers Semiconductors"
2026-10-20
2026-10-22T12:54:22+02:00
SSMIY unsponsored ADR (PINK)
Last 7.30 USD (frozen, pre-US-open); bid/ask 7.11/8.10, spread 12.2%; 52-week 10.21/6.69; implies about 3 ordinary shares per ADR (inference)
2026-10-22
2026-10-22T12:55:22+02:00
How this squares with the rest of the page: the LSEG single analyst is consistent with the Redeye figures used in the valuation section (SEK 7.4 fair value, revenue 273/458/621M), so "consensus" on this page is one house seen through two data vendors. Morningstar's SEK 16.23 is a quantitative model value with very high uncertainty, not a research call. The one TipRanks Buy is the January 2026 Northland record already listed under analyst records.
Not captured: no live Stockholm quote (price, volume, 52-week range) on the read-only login; no short-interest or securities-lending data for this listing; no events or earnings-calendar tab in the Company layout; the Morningstar "Full Report" PDF was not downloaded; the 2DG (Xetra) line was not opened. The 52 capture screenshots are listed in the image manifest; four are embedded above.
Leadership and governance: the CEO, his letters, and the NRE story (22 October 2026)
Added · Content updated · Evidence reviewed · Source · Period end 2026-06-30 · Review after 2026-11-26
Who runs the company. Vickram Vathulya is not a founder; Sivers dates to 1951. He joined from outside as President and CEO on 19 August 2024 after a search by Hunt Scanlon (appointment). He replaced Anders Storm, CEO since 2016, who resigned on 26 March 2024 "for new challenges outside the Company" with no further reason. Chair: Bami Bastani. After the 15 June 2026 AGM the board is Bastani, Todd Thomson, Karin Raj, Joakim Nideborn and Helena Svancar; Erik Fällström (largest holder, 13.86% at end-2025), Tomas Duffy and Keith Halsey left. CFO Heine Thorsgaard since September 2025.
Track record. Philips/NXP (1999 to 2008), then twelve years at Maxim Integrated ending as VP and GM of Core Products, then President of Nuvotronics, a millimetre-wave subsidiary of Cubic, from November 2022 to August 2024. A divisional operator at a large analog house; no prior public-company CEO role, no photonics background, no controversies found. No independently verifiable outcome from Nuvotronics.
Shipment volumes "expected to ramp in the next 18 to 24 months"
Ayar is absent from the Q4 2025, Q1 2026 and Q2 2026 letters; no volume order announced; photonics hardware −23% in H1 2026
Q4 2025 (26 Feb 2026)
LiDAR ramp Q4 2026; pipeline $453M; breakeven at $50 to 55M revenue "within two years"
Delivered:production orders announced 20 Oct 2026, two days before the Q4 window; "shipments will begin in Q4 2026 against rolling production orders". Breakeven still implies ~SEK 500M revenue versus SEK 116M in H1 2026
LiDAR orders "expected imminently" for Q4 2026; revenue inflection Q4 2026; Jabil beta Q4 2026, production orders H1 2027; telco FWA by end-2026; US listing prep done H1 2027; Glasgow functional end-2027
LiDAR orders delivered 20 Oct 2026 (first milestone of this letter met). The rest is testable at the Q3 report on 26 Nov 2026 and the Q4 report on 25 Feb 2027
Paused Nov 2024; replaced by a potential US dual listing (15 Apr 2026); not delivered
Pattern: hard milestones move one or two quarters right each letter while the non-binding pipeline figure ($453M → $799M → $1.2B) is the headline.
The NRE question, with the numbers (SEK m, restated).
Period
Hardware
NRE
Total
Photonics HW
Wireless HW
FY2024
131.3
87.3
219.2
80.1
51.2
FY2025
127.2
178.7
306.6
93.4
33.8
Q2 2025
25.7
35.5
61.4
17.2
8.6
Q2 2026
29.2
24.6
53.8
15.9
13.3
H1 2026 vs H1 2025
56.8 vs 66.9 (−15%)
58.8 vs 77.1 (−24%)
115.6 vs 144.3 (−20%)
33.7 vs 43.9 (−23%)
23.1 vs 23.0
All NRE is Wireless; Photonics carries no NRE after the restatement, so "shifting from NRE to product" is a Wireless story and says nothing about AI-optics demand. 2025 growth was NRE doubling on US defence programmes (three Wireless customers were 60% of revenue) while hardware fell. Contract liabilities (customer prepayments for new development work) fell from SEK 32.3M to 11.6M during 2025 while contract assets (NRE recognised but unbilled) rose from 54.7M to 100.4M: fewer new prepaid contracts and more unbilled work in progress, which is what a development pipeline running off looks like. The Q2 "product revenue +18%" headline is Wireless hardware; photonics hardware fell 8% in Q2 and 23% in H1. Sources: annual report 2025 Note 6, Q2 2026 report p. 14, Q1 2026 report p. 13.
Cash and dilution. Cash SEK 43.5M at end-2025 (operating cash flow −57M), 26.6M at end-Q1 2026, 62.7M at end-Q2 before the SEK 700M raise closed (Q2 operating cash flow −70M). Headcount 130 (June 2026).
Insider alignment. Vathulya holds about 4.54M shares (~1.3%) plus 3.7M options, committed at hiring to buy 2M shares, and bought 70,000 more after the lock-up on 21 July 2026 at about SEK 38 to 42: a net buyer above today's price. Chair Bastani sold 275,000 shares the day the lock-up expired (16 July 2026) and director Thomson's Headwaters sold 950,000 by 22 July (lock-up release). A circulated report that the CEO sold 1.23M shares was false (Boerse Express). 2025 pay SEK 5.1M, no bonus.
Red flags.
May 2026 restatement: 2024 net sales cut from 243.7 to 219.2M (−10%), 2024 net loss widened from −116.3 to −183.9M, 2025 EBIT from −141.3 to −177.8M, equity cut by SEK 127M. Causes: NRE recognised too early, hardware timing, distributor returns, inventory write-ups, a loss-making NRE contract, understated amortisation and a SEK 28.4M impairment of capitalised Wireless development. Framed as a PCAOB audit uplift; these are IFRS errors in the core revenue model, under the current CEO for 2025.
Share count up ~32% in 20 months; the 22 October 2026 EGM votes on a new option plan and Series C shares.
Dagens Industri, 31 Aug 2026 called the Q2 report catastrophic and said sell; the stock fell 15% that day and 27% over seven sessions.
Share price under his tenure: low SEK 1.76 (13 Nov 2024), high SEK 110 (3 Jun 2026), about SEK 23 to 24 now (TradingView).
Balanced verdict. For: real Wireless wins (ALL.SPACE $8.2M, Tachyon $3M, CHIPS Act programmes), genuine photonics partner names (Jabil, GlobalFoundries, POET, O-Net), a SEK 700M raise executed near the top, no debt, and the CEO buying with his own money while the chair and a director sold. Against: the group has not grown once restated; the AI division shrank 23% in H1 2026; the Ayar ramp promise vanished; the SPAC never closed; the restatement found NRE revenue overstated; new development bookings are drying up; guidance slides right every quarter. He reads as a credible divisional operator with aligned incentives, not a proven public-company CEO, and the letters run ahead of the numbers. The LiDAR production orders of 20 October 2026 are the first delivered milestone of the Q2 letter and count in his favour; the first hard numerical test is the Q3 report on 26 November 2026 and whether LiDAR shipments and Jabil orders show up in Q4.
Added: 2026-10-22. An adversarial check of the diagram and scenario inputs found these errors in earlier drafts; the published figures above are the corrected ones.
Claim in earlier draft
Correction
Basis
8 laser dies per 1.6T module
2 to 4 CW lasers per DR8 photonic IC (8 optical lanes, not 8 lasers)
Credo Oz8, OpenLight DR8
1 to 2 optical modules per GPU
3 to 4 per GPU across the fabric (both link ends, fat-tree tiers)
SemiAnalysis
1 GW campus $10 to 15B
$35 to 50B with chips; $14B is development only
NBER, Bernstein, Bloomberg
1.6T module $1,000 to 1,500
$1,500 to 2,000 (list $1,300 to 2,400)
Ascent Optics, FS.com
Sivers die $2 to 10
$5 to 30 est.; no public price
vendor BOM examples
GB200 rack with 1.6T modules
GB200 uses 400G/800G; 1.6T belongs to GB300/Rubin, so the rack is labelled GB300/Rubin-class
SemiAnalysis
DR8 70 to 100 mW tie to the Jabil module
Release names only "DFB lasers"; the specific part is inference and was removed
Sivers release 15 Apr 2026
CW-DFB datacom TAM ~$3B
No published dollar source; shown as $1B (published) versus $3B (unit-derived)
FMI, TrendForce
Base case versus consensus
Labelled bullish versus the single-analyst path, not a mid case
MarketScreener, Fintel
LiDAR cumulative figure USD 28 to 53M (Q4 2025 report)
Updated to USD 53 to 138M over the product lifecycle per the 20 Oct 2026 release; earlier figure superseded
Sivers release 20 Oct 2026
Diagrams on the web page are responsive HTML built from the tables in this report; the PNG posters linked under each are static exports of the working design canvases and may clip a footer line.
Sivers has identifiable products and commercial progress worth monitoring. But losses, cash demands and uncertain production conversion mean the AI narrative alone does not establish an attractive investment.
Valuation incomplete. We need a verified current price, updated capital structure and cash reconciliation, followed by bear/base/bull scenarios before reaching an entry decision.
Added and updated dates describe our content. Source dates describe the evidence. A layout refresh changes neither.
Review dates use day precision; the infographic also records its exact local download time. “Review due” is a research task, not confirmation that information is wrong. Historical opinions and forecasts remain dated.
This page is rendered in HTML without requiring JavaScript. Its underlying research, dated analyst records and information history are available below. The Markdown is a detailed research note; use the history JSON for per-piece freshness and the HTML for the complete presentation.
Transparent sourcing. Idea: Serenity · Public thesis reconstruction. Reported figures: issuer disclosures. Analyst opinions: linked providers and secondary reporting, as labelled. Photographs/illustration and company logo: Sivers Semiconductors, used for editorial identification; no affiliation implied.